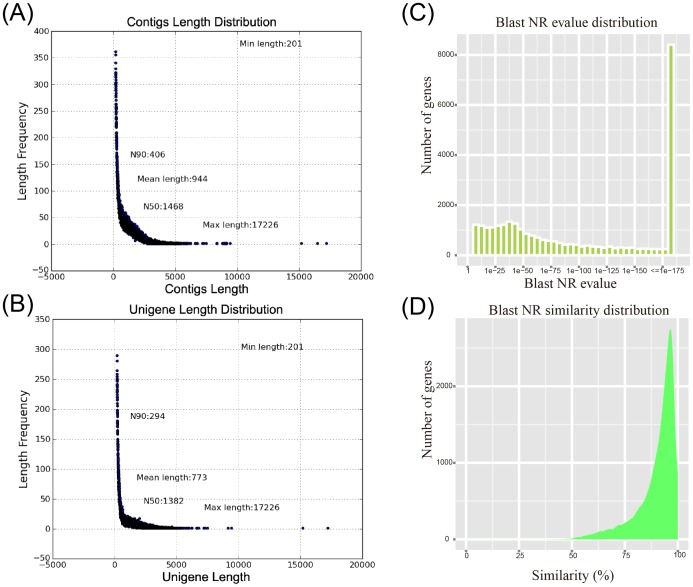
Figure 1. The length distribution of contigs and unigenes, and E-value distribution and similarity distribution of Blast NR hits.
Minimum length, N90; mean length, N50; and maximum length of contigs and unigenes are shown in their corresponding positions. (A) Contigs length distribution. (B) Unigene length distribution. (C) E-value distribution of Blast NR hits for matched unigene sequences. (D) Similarity distribution of Blast NR hits for each unigene.

