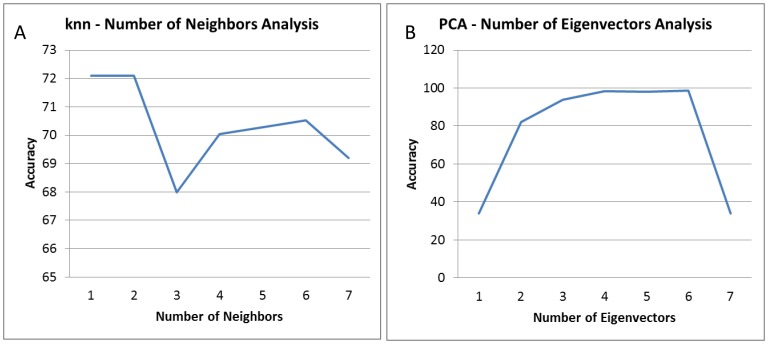
Figure 2. Classification results with varied parameters.
A) The KNN classifiers were tested by varying number of neighbors, k from 1 to 7. The plot shows average accuracy for each k. k = 1 and k = 2 resulted in the best performance. B) PCA-LDA classification result with varied number of eigenvectors. Our PCA-LDA classifiers were tested for dimensionality reduction varied from one through seven different eigenvectors. The plot shows the highest accuracy when using six eigenvectors.

