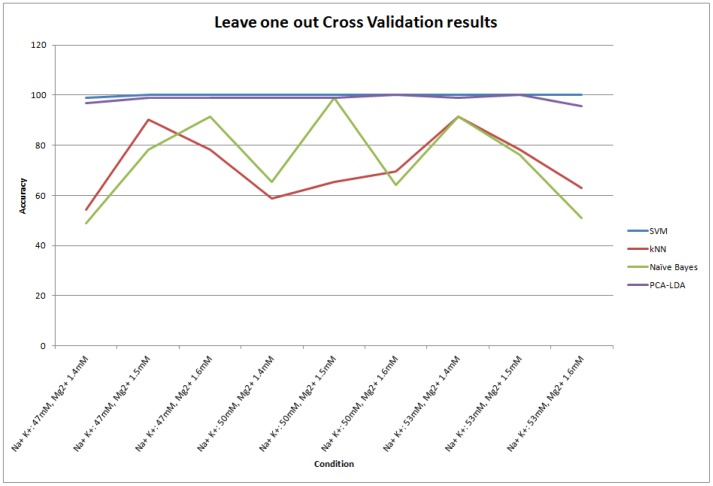
Figure 5. Accuracy of different classifiers under different conditions.
Horizontal axis shows the different Na+, K+ and Mg2+ concentrations respectively that were used to generate the predict curves. Vertical axis shows accuracy in %age. Different curves labeled with different legends represent the performance of different classifiers.

