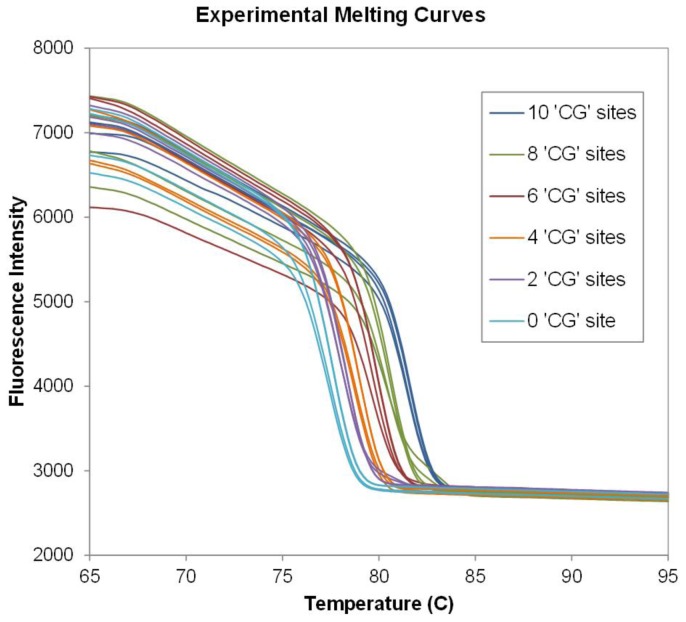
Figure 6. Experimental melt curves from six different number of ‘CG’ sites DNA sequences.
Melt curves of six synthetic DNA sequences from two duplicate experiments from different days. Different colors represent different sequences as legend. The fully methylated sequences represented in dark blue color with 10 ‘CG’ sites and then two ‘CG’ sites were changed to ‘TG’ to be the next target of 8 ‘CG’ sites and so on until all ‘CG’ sites were changed to ‘TG’ as 0 ‘CG’ sites (non-methylated) represented in light blue.

