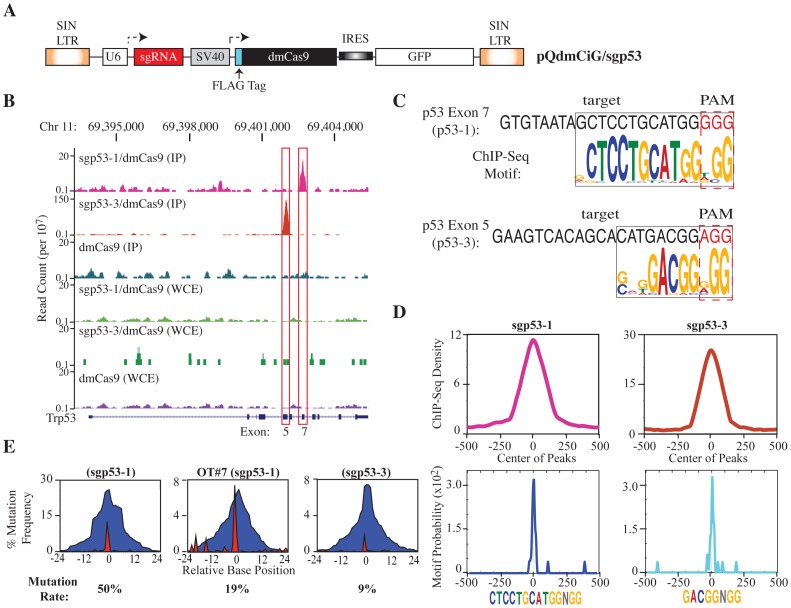
Figure 1. Genome-wide binding of sgp53/dmCas9.
A. Schematic representation of retroviral vector design expressing sgp53-1 or sgp53-3, dmCas9, and GFP. B. Genomic tracks displaying ChIP-seq and WCE-seq data from sgp53-1/dmCas9-, sgp53-3/dmCas9-, and dmCas9-infected cells across a ∼12 kbp region spanning p53. The RefSeq gene track for Trp53 is shown below the profiles. C. Identification of enriched motifs in sgp53-1/dmCas9 and sgp53-3/dmCas9 ChIP samples. The p53 exon target site and flanking PAM (red) are indicated. The sequence logo depicts the nucleotide distributions of overrepresented binding sites found by MEME-ChIP analysis in segments targeted specifically by sgp53-1/dmCas9 (25 sites, p-value 1.4×10⁻²⁰) and sgp53-3/dmCas9 (24 sites, p value 3.2×10⁻¹⁵). D. Top: ChIP-enriched sequence read density. Bottom: Distribution of seed motif adjacent to a PAM within ∼500 bp of peak summits. E. Location and mutation frequency across 48 nucleotides centered from the 3rd nucleotide of the seed sequence upstream of the PAM (set at 0) for sgp53-1, OT#7, and sgp53-3 target sites. Blue indicates deletion and red indicates insertions. The percentage of read counts harboring mutations is indicated below the panel.

