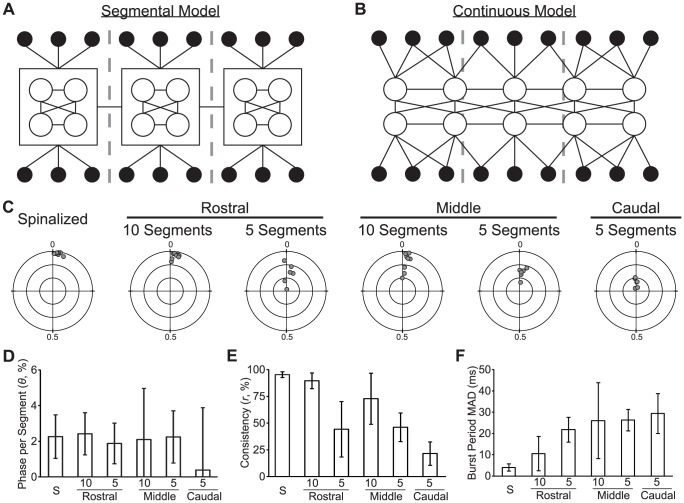
Figure 3. Rostrocaudal Phase Consistency and Motor Rhythm Stability are Decreased by Spinal Transection.
(A–B) Diagrams of segmental (A) and continuous (B) models of the spinal locomotor CPG. The models show the spinal circuit with the rostrocaudal axis horizontal and the mediolateral axis vertical. Body segment boundaries are shown with gray dashed lines. In both models, each segment contains two groups of motor neurons (black-filled circles), each group innervating one lateral hemi-segment. In both models, interneurons (open circles) form synaptic connections (black lines) with each other and with motor neurons. In the segmental model (A), each segment contains a reiterated interneuron circuit that controls local motor neurons and communicates with other segmental circuits. In the continuous model (B), interneurons are distributed and form synaptic connections based on inter-somatic distance and are independent of segmental boundaries. In both models, patterns of interneuron connectivity are strictly illustrative and should not be interpreted as definite synaptic connections between defined interneurons. (C) Polar plots showing the normalized rostrocaudal phase vector sum (gray circle) of each preparation in the experimental group indicated above the plot. Concentric circles are plotted at distances of 0.33, 0.66 and 1.0 from the fixed point; cross-hairs separate the quadrants. (D–F) Plots of mean phase delay per segment (D), mean phase consistency (E), and mean burst period MAD (F) of each experimental group. The bar labeled “S” is the spinalized group. Significant differences are not indicated due to the number of pair-wise comparisons (see text in Results ).

