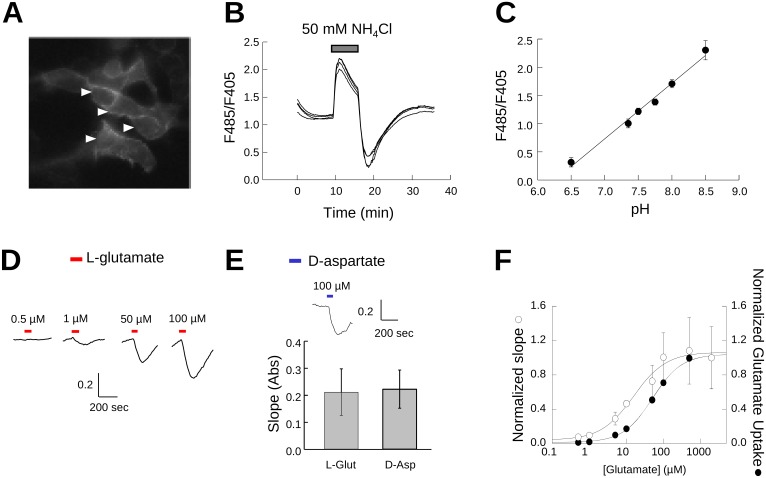
Figure 5. mEGFPpH detects intracellular pH changes induced by glutamate transport.
Representative image of mEGFPpH transfected HEK293 cells (A) and representative fluorescence traces from HEK293 cells expressing mEGFPpH perfused with 50 mM NH4Cl (B). Y axis indicates the ratio of fluorescence emission at 510 nm from excitation at 485 nm and 405 nm (F485/F405) (B). Arrows in A indicate the cells from which the traces in B were recorded. C) Fluorescence ratio (F485/F405) as a function of induced intracellular pH following NH4Cl perfusion (B). D) Perfusion of increasing concentrations of L-glutamate results in increased rate of mEGFPpH fluorescence decrease in HEK293 cells co-transfected with EAAT3 and mEGFPpH. The Y-axis units are the fluorescence ratio for emission at 510 nm with excitation at 485 and 405 nm (F485/F405). E) Perfusion with 100 µM D-aspartate results in intracellular acidification with slope magnitude similar to that for 100 µM L-glutamate (bar graph). Y-axis units are the fluorescence ratio for emission at 510 nm with excitation at 485 and 405 nm (F485/F405). F) Representation of the magnitude of the slope of mEGFPpH fluorescence ratio decrease (left y-axis) as a function of the applied glutamate concentration compared with the glutamate transport activity (right y-axis) in similarly transfected cells.

