
Figure 2. Mitochondrial DNA coverage per base beyond bait sequences for six historical koala samples.
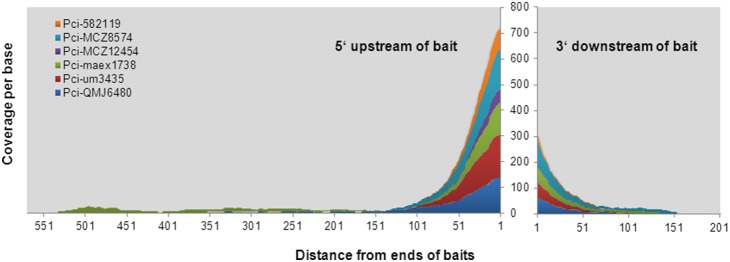
Reads mapping to the koala mitochondrial DNA genome (AB241053) are presented as per base coverage starting from the first base beyond the bait. The 5′ end of the bait is shown to the left of the X axis 3′ to the right. The six historical koala age and sample information are shown in Table S1. The average library insert size for all six libraries was 93 bp. No correlation between year of sample collection and extension beyond the bait end was observed. The results demonstrate that only limited flanking sequence was captured for the six historic samples tested.