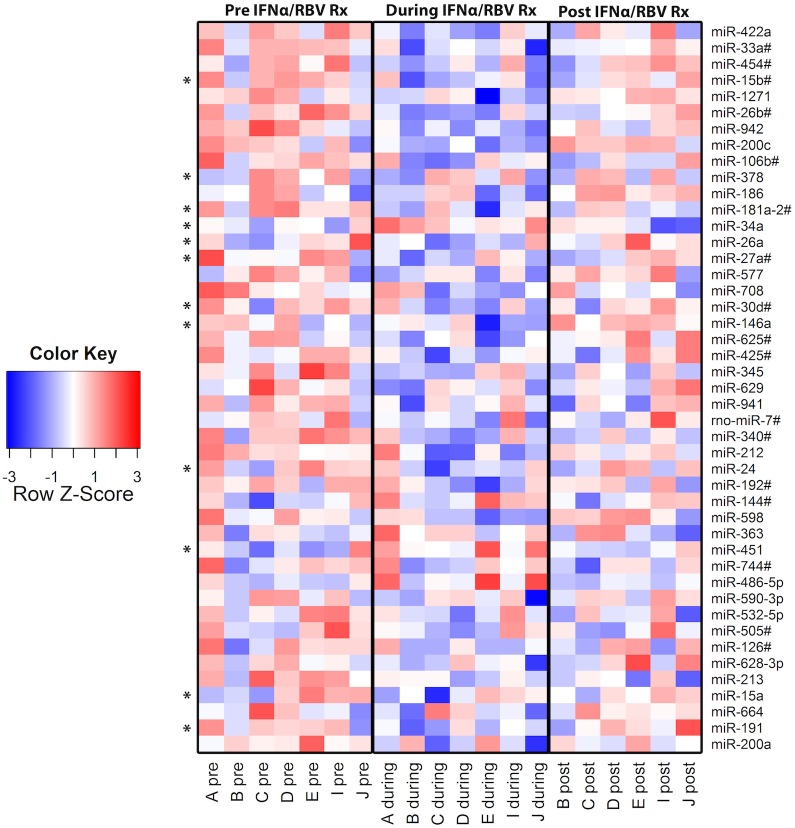
Figure 1. Heat map representing effects of IFN-α/RBV treatment on the expression of individual miRNAs.
45 miRNAs were significantly modulated by IFN-α/RBV in vivo, based on a paired t test and an uncorrected significance cutoff of p<0.05. Relative copy numbers of each miRNA are reported. Blue color indicates ≤−3 SD from the mean, red indicates ≥3 SD from the mean, and white represents the mean. Asterisks indicate previously established association with HIV-1.

