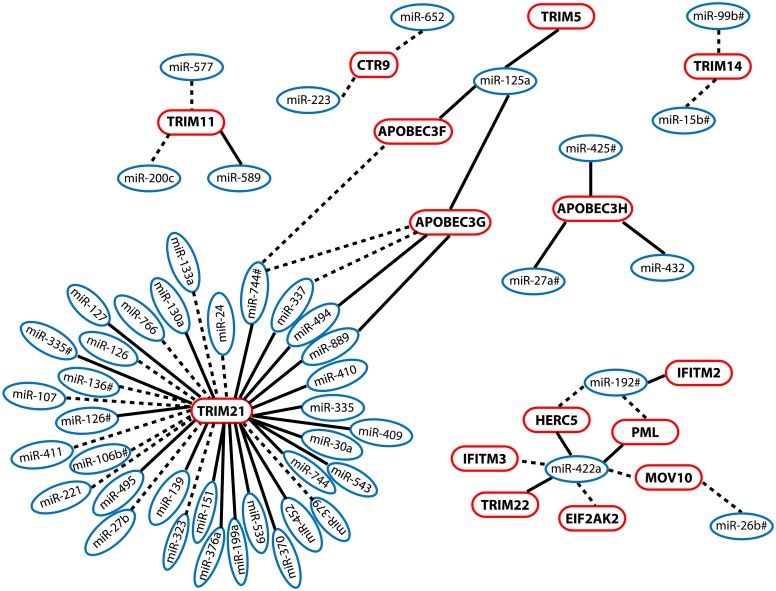
Figure 4. Global network of putative regulatory interactions between miRNAs and anti-HIV-1 restriction factor mRNAs.
miRNA and mRNA expression data were measured in longitudinal PBMC samples from IFN-α/RBV-treated patients enrolled in the SHCS. Two variables were used to generate the network: 1) inverse expression relationships between a given miRNA-mRNA pair (represented as a dashed line drawn between a miRNA – mRNA pair), and 2) Significant sequence homology between a given miRNA seed region and a restriction factor 3′ UTR (word size 4, alignment length > = 5, e-value<1.0). Significant sequence homology is represented by a solid line. miRNAs are listed in blue; restriction factors are listed in pink.

