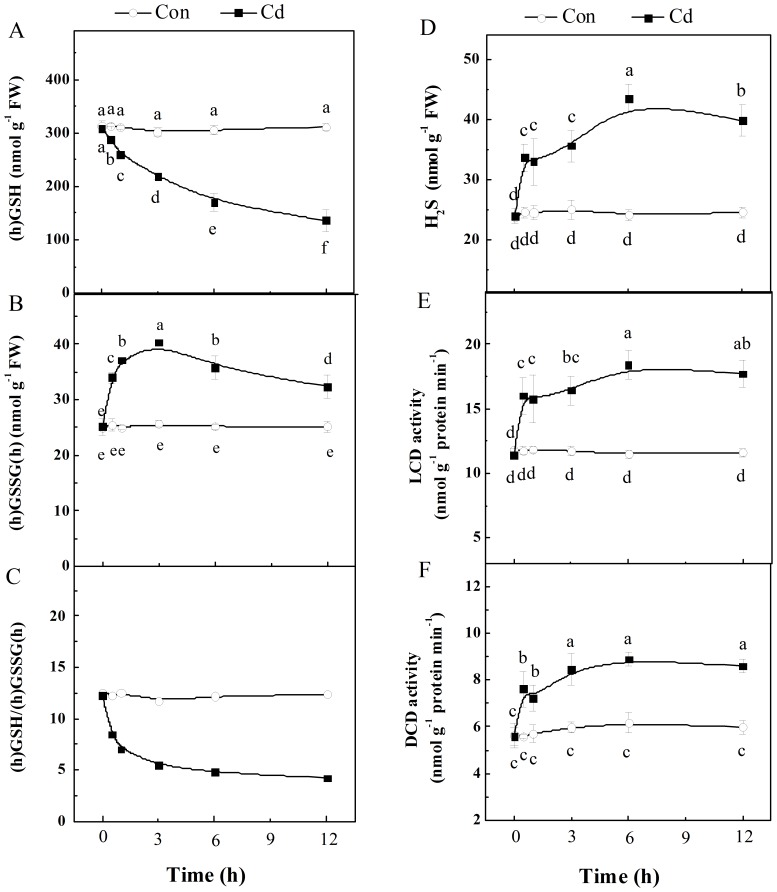
Figure 1. Time course changes of GSH pool and H2S synthesis upon Cd stress.
Upon 200 µM CdCl2 treatment for 12 h, contents of (h)GSH (A), (h)GSSG(h) (B) and H2S (D), the ratio of (h)GSH/(h)GSSG(h) (C), and the activities of LCD (E) and DCD (F) in root tissues were analyzed. Values are means ± SD of three independent experiments with three replicates for each. Bars denoted by the same letter did not differ significantly at P<0.05 according to Duncan's multiple range test.

