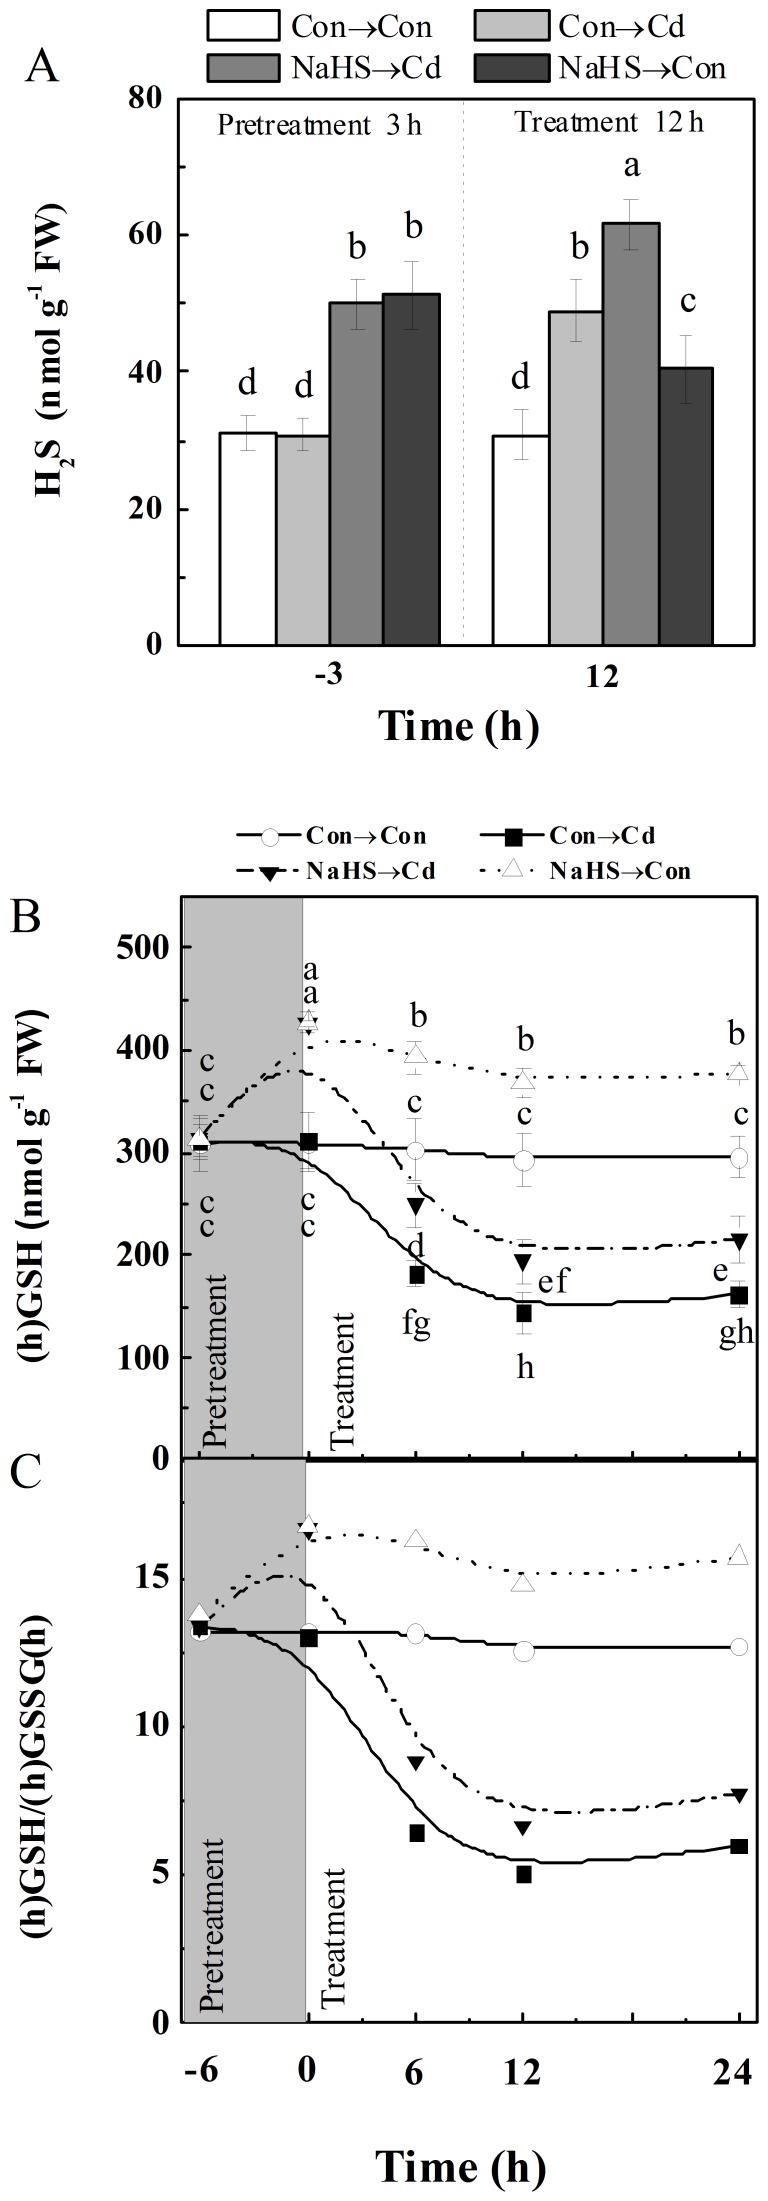
Figure 2. NaHS increased endogenous H2S and (h)GSH contents, and the ratio of (h)GSH/(h)GSSG(h) upon Cd stress.
Endogenous H2S concentration in root tissues (A) was detected at 3 h after the beginning of 100 µM NaHS pretreatment (−3 h), and 200 µM CdCl2 or chemical-free control treatments for 12 h (12 h). Meanwhile, contents of (h)GSH (B) and the ratio of (h)GSH/(h)GSSG(h) (C) in root tissues were detected at the indicated time points of treatments. Values are means ± SD of three independent experiments with three replicates for each. Bars denoted by the same letter did not differ significantly at P<0.05 according to Duncan's multiple range test.

