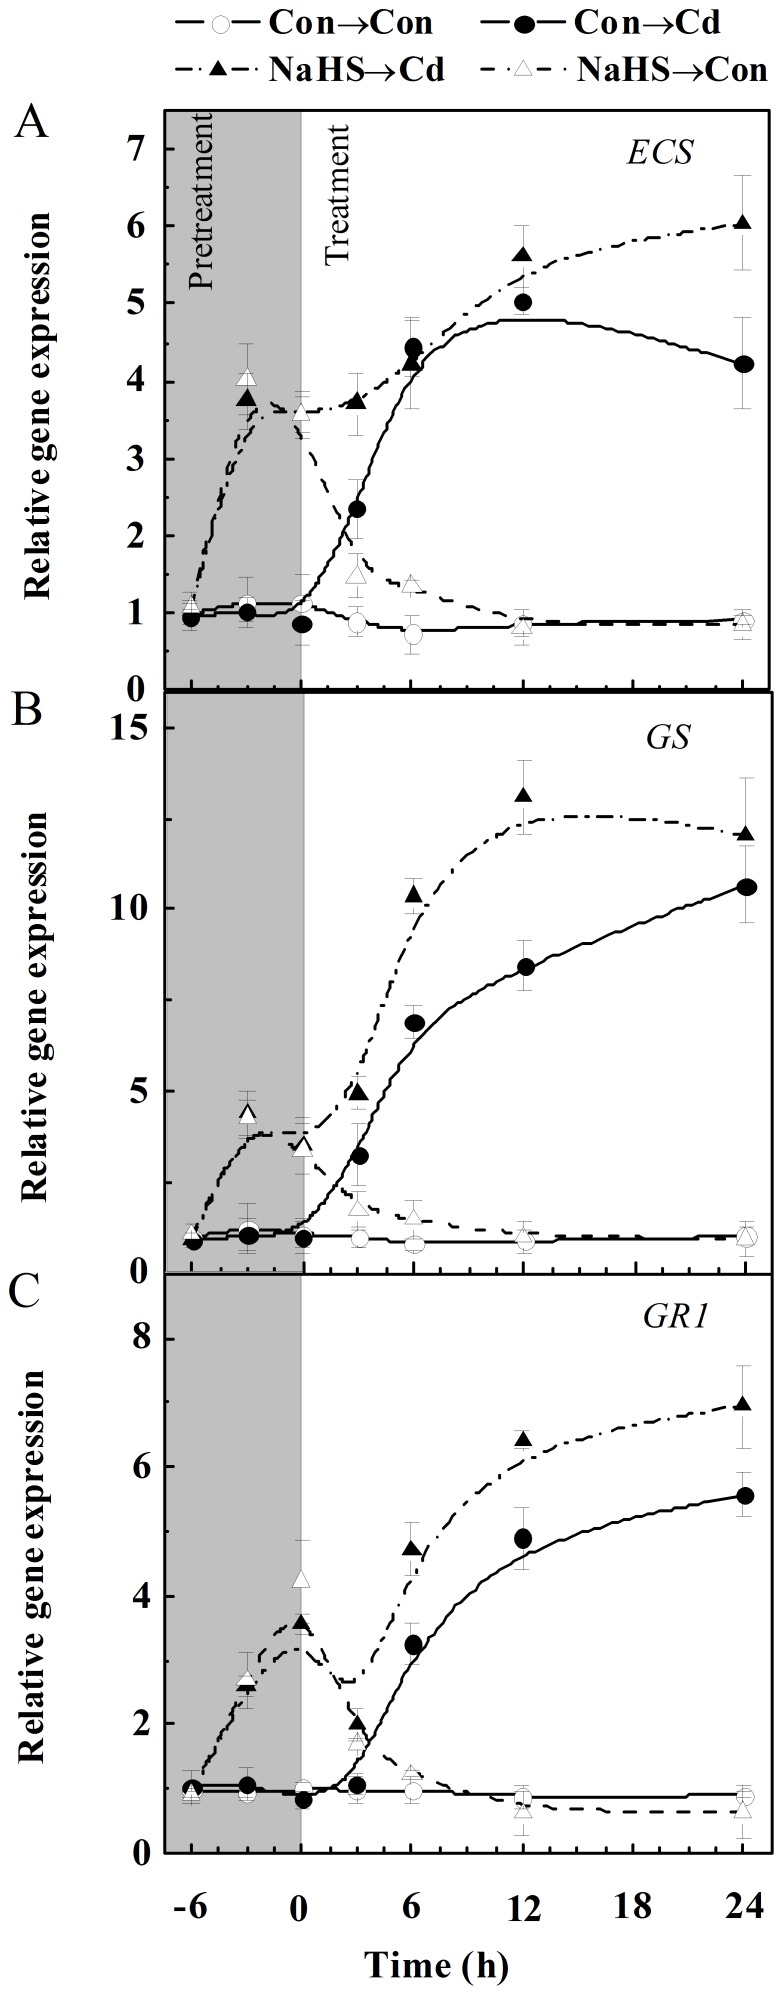
Figure 3. Time course of transcripts responsible for (h)GSH metabolism regulated by NaHS and Cd.
Seedlings were pretreated with or without 100 µM NaHS for 6 h and then exposed to 200 µM CdCl2 for another 24 h. The expression levels of ECS (A), GS (B) and GR1 (C) in root tissues analyzed by real-time RT-PCR are presented as values relative to the control at the beginning of pretreatment, normalized against expression of two internal reference genes in each sample. Values are means ± SD of three independent experiments with three replicates for each.

