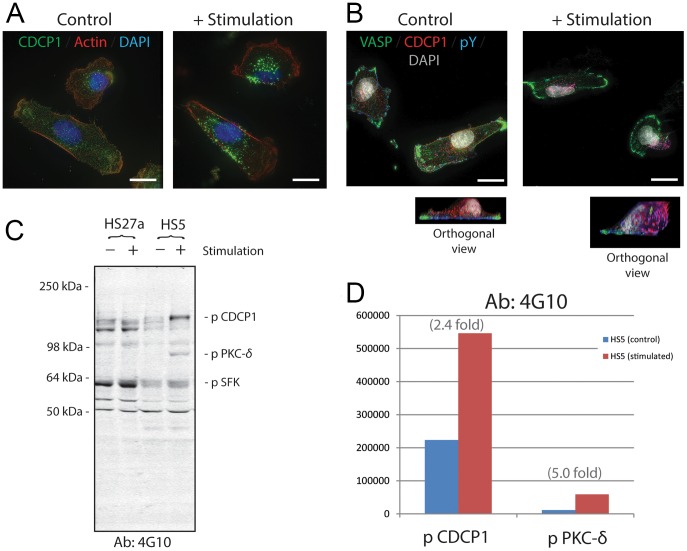
Figure 2. Immunofluorescence staining and protein blot analysis of CDCP1 in HS5 stromal cells before and after stimulation.
Panel A: HS5 cells were treated with and without P3D9 stimulating antibody against CDCP1 for 30 minutes (right and left panels, respectively). They were then fixed and stained for CDCP1 (green), Actin (red) and Nuclei (DAPI, blue). Scale bars, 20 µm. Panel B: Control and stimulated HS5 cells were fixed and stained for VASP (green), CDCP1 (red), phosphotyrosine (pY, blue; detected by 4G10 antibody) and nuclei (DAPI, gray). Orthogonal images of the control and stimulated cells are shown. Pink fluorescence indicates the co-localization of CDCP1 and pY, suggesting that CDCP1 was tyrosine-phosphorylated. Original objective, X60. Scale bars, 20 µm. Panel C: Western blot analysis of detergent extracts of HS27a and HS5 cells before (−) and after (+) P3D9 stimulation. 4G10 antibody against pY was used. The bands of phosphorylated CDCP1, pSFK and PKC-δ were indicated according to the published studies [25], [46]. Identification of the PKC-δ band was confirmed by knock-down experiments of HS5 cells using siRNA for PKC-δ (Figure S3 in File S1). Panel D: Integrated pixel intensity of the bands of phosphorylated CDCP1 and PKC-δ in the blot of Panel C was quantitated by using Odyssey application software. Blue and red bars indicate HS5 cells before and after stimulation, respectively.

