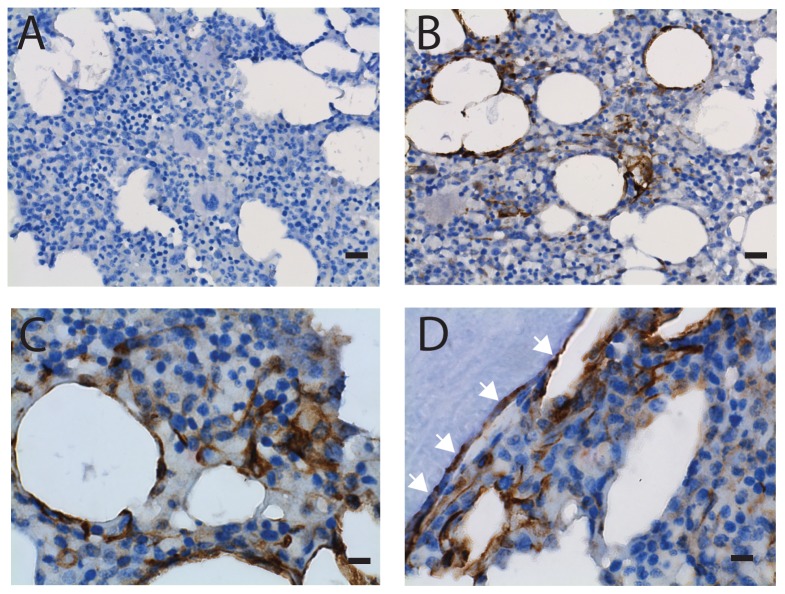
Figure 5. Immunohistochemical detection of CDCP1+ cells in marrow biopsy.
Marrow biopsies of the healthy donors were subjected to immunohistochemistry using isotype-matched control antibody (panel A) and an anti-CDCP1 antibody (Cell Signaling Technology, panels B-D). Positive cells were stained in brown and nuclei were counter-stained using hematoxylin (blue). Panels B and C show CDCP1+ cells clustered near some fat cells. Panel D shows CDCP1+ cells near bone. White arrows indicate that the thin-flattened cells surrounding bone were CDCP1-positive. Original objective, X40 for panels A and B (black bars indicate 20 µm); X100 for panels C and D (black bars indicate 8 µm).

