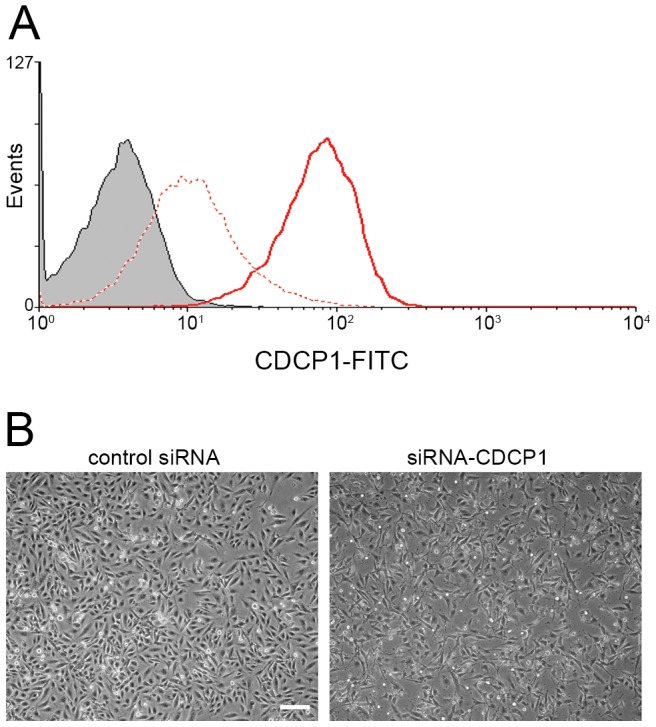
Figure 6. Knock-down of CDCP1 in HS5 cells by siRNA.

Panel A: Surface protein expression of CDCP1 was analyzed by flow cytometry. HS5 cells were transfected with siRNA for CDCP1 (dotted red line) or GFP (solid red line) and cultured for 3 days, followed by flow cytometry for CDCP1. Gray area indicates the isotype-matched control. Expression of an unrelated protein, Integrin alpha 3 (ITGA3/CD49c) did not change (shown in Figure S8 in File S1). Panel B: Phase contrast images of the transfected cells are shown. HS5 cells were transfected with siRNA for GFP (left panel) or CDCP1 (right panel) and cultured for 3 days. Original objective, X20. A white bar indicates 200 µm.
