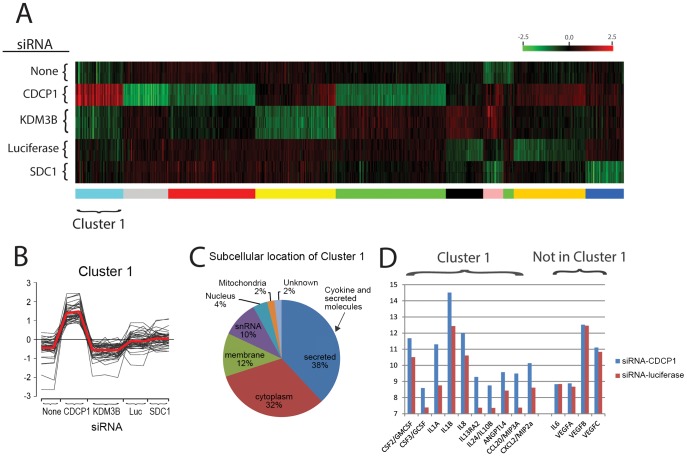
Figure 7. K-means clustering analysis of microarray data obtained HS5 cells after knocked down for CDCP1 and unrelated control gene targets.
Normalized log2 intensities were probe-wise median centered across all conditions. Panel A: A heat map of clusters generated from the 573 probes showing differential gene expression (defined as |log2(ratio)| ≥1 and FDR of 5%) in the comparison between control and knock downed HS5 cells. Panel B: Log-ratio values for the 50 probes comprised of Cluster 1 which show upregulation in CDCP1 KD cells. Red line is the mean expression value of the cluster members. Panel C: A pie chart showing subcellular location of probes in Cluster 1. Blue pie indicates cytokine and secreted molecules. Panel D: Log 2 gene expression values of cytokines and chemokines present or absent in Cluster 1. Blue and red bars indicate HS5 cells transfected with siRNA for CDCP1 or luciferase, respectively.

