Figure 3.

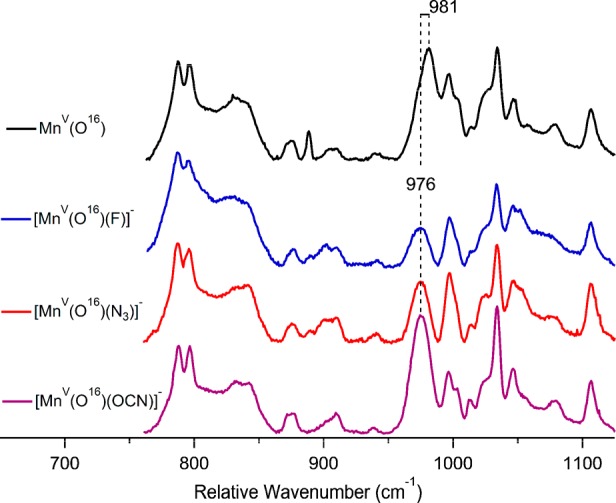
Low-frequency resonance Raman spectra of 16O [MnV(O)(TBP8Cz)(X)]− where X = no ligand, F−, N3−, or OCN−. The resonances near 900 cm–1 were used to scale the spectra. Data were collected using a 413.2 nm krypton-ion laser line.

Low-frequency resonance Raman spectra of 16O [MnV(O)(TBP8Cz)(X)]− where X = no ligand, F−, N3−, or OCN−. The resonances near 900 cm–1 were used to scale the spectra. Data were collected using a 413.2 nm krypton-ion laser line.