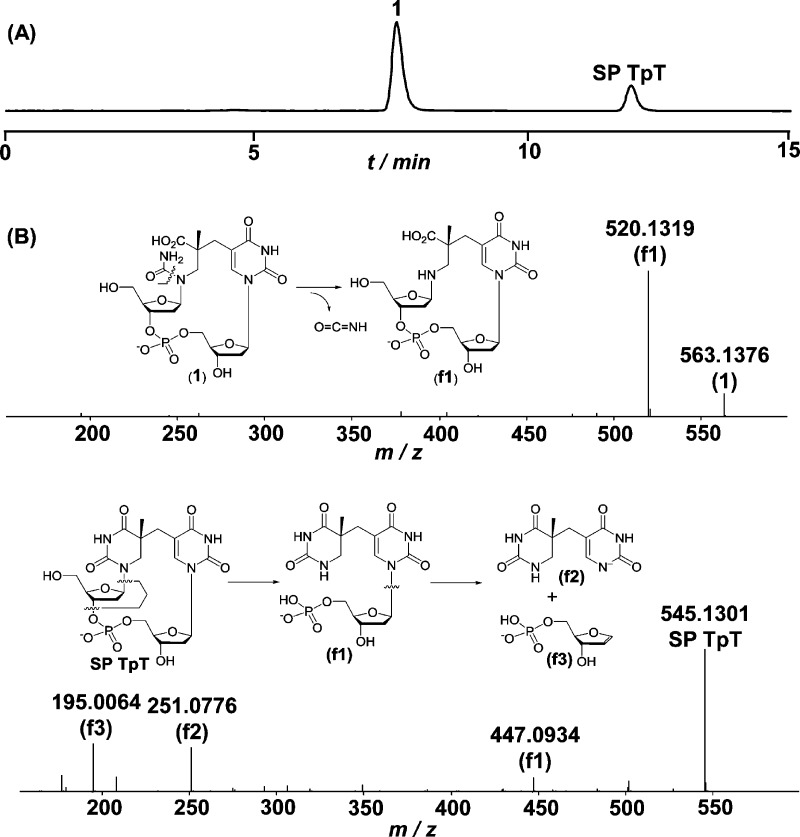
Figure 2.
(A) HPLC chromatograph (monitored at 260 nm) of the SP TpT hydrolysis reaction in the presence of 0.2 M KOH at ambient temperature for 24 h. (B) MS/MS analyses (negative ion mode, [M – H]−) of dinucleotide SP TpT (lower) and the SP hydrolysis product 1 (upper) as well as the structures of other major fragments formed.

