Figure 3.
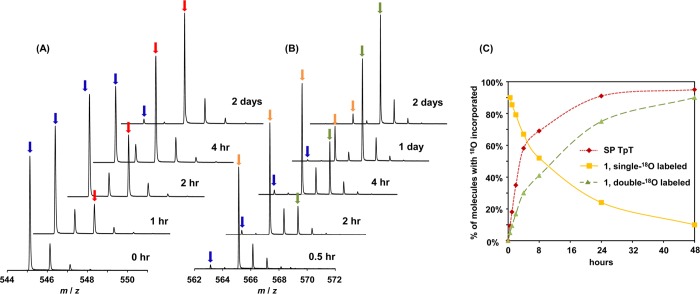
ESI-MS spectra (negative ion mode) of the SP hydrolysis reaction in 0.2 M KOH at ambient temperature in 97% 18O water. (A) The gradual incorporation of 18O into SP. The peaks indicated by blue arrows exhibit an m/z of 545.1, corresponding to the [M – H]− signal of SP without any 18O incorporation. The peaks indicated by red arrows exhibit an m/z of 547.1, corresponding to the [M – H]− signal of SP with one 18O incorporated. (B) The gradual incorporation of 18O into the SP hydrolysis product 1. The peaks indicated by blue arrows exhibit an m/z of 563.1, corresponding to the [M – H]− signal of 1 without any 18O incorporation. The peaks indicated by orange arrows exhibit an m/z of 565.1, which correspond to the [M – H]− signal of 1 with one 18O incorporated and gradually decrease during the course of the reaction. The peaks indicated by green arrows exhibit an m/z of 567.1, which correspond to the [M – H]− signal of 1 with two 18O incorporated. (C) Time course indicating the incorporation of 18O into SP and SP hydrolysis product 1. The incorporation of the second 18O into 1 is slower than the 18O incorporation into SP, suggesting that the second 18O incorporation occurs by reacting with the 18O labeled SP.

