
Figure 2.
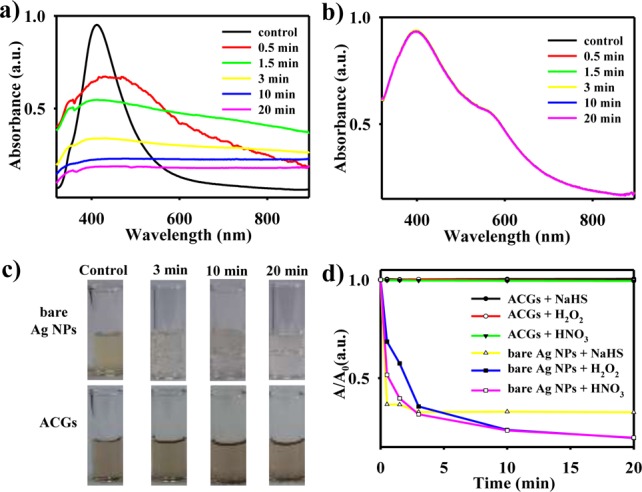
UV/vis spectra of bare Ag NPs (a) and ACGs (b) after adding 220 mM H2O2 for various times. (c) Digital photos of bare Ag NPs and ACGs suspensions mixed in 220 mM H2O2 for various times. (d) A/A0 (relative absorbance intensity, where A0 and A are the optical absorbance without and with the presence of 0.15 mM NaHS, 220 mM H2O2, or 75 mM HNO3, respectively) at different time points.