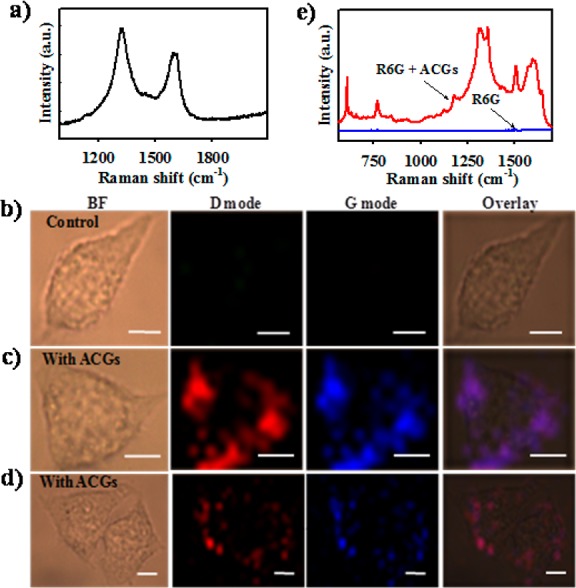
Figure 3.

SERS with the ACGs. (a) Raman spectrum of the ACGs with the G and D bands of graphitic shell. High-resolution Raman image of MCF-7 cells treated without (b) and with (c) ACGs using 1 s integration/pixel. (d) Rapid Raman image of MCF-7 cells treated with ACGs using 0.1 s integration/pixel. (e) Raman spectra of 20 μM R6G with (red) and without (blue) ACGs. BF, bright field; scale bar, 10 μm.
