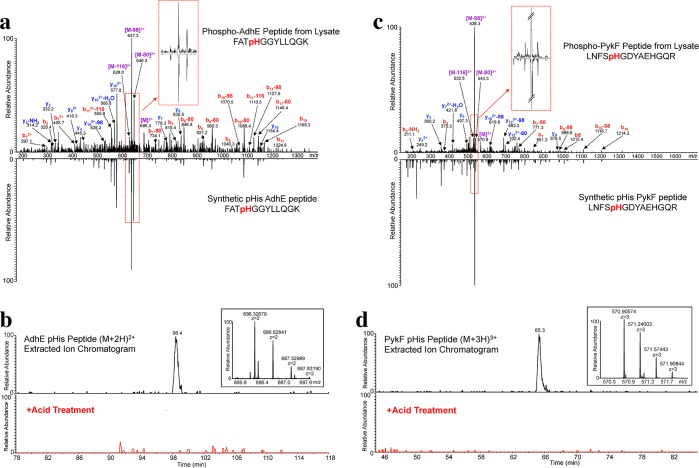
Figure 6.
Validation of AdhE and PykF pHis MS/MS peptide assignments. (a) CID MS/MS spectrum of the endogenous E. coli AdhE pHis peptide annotated with the major matched b- and y-type ions indicated. The synthetic Adhe pHis peptide is shown in the mirror image. Inset into the spectrum is an enlargement of the neutral loss pattern for the endogenous vs the synthetic pHis peptide. (b) Extracted ion chromatogram of the [M + 2H]2+ AdhE pHis peptide ion from E. coli lysate (top) and from the acid-treated lysate (bottom, red trace). Inset into the spectrum is a high resolution MS spectrum of the precursor species at m/z 686.32679. (c) CID MS/MS spectrum of the endogenous E. coli PykF pHis peptide, with the prominent matched b- and y-type ions as indicated. The synthetic PykF pHis peptide is shown in the mirror image. Inset into the spectrum is an enlargement of the neutral loss pattern for the endogenous vs the synthetic pHis peptide. (d) Extracted ion chromatogram of the [M + 3H]3+ PykF pHis peptide ion from E. coli lysate (top) and from the acid-treated lysate (bottom, red trace). Inset into the spectrum is a high resolution MS spectrum of the precursor species at m/z 570.90574.

