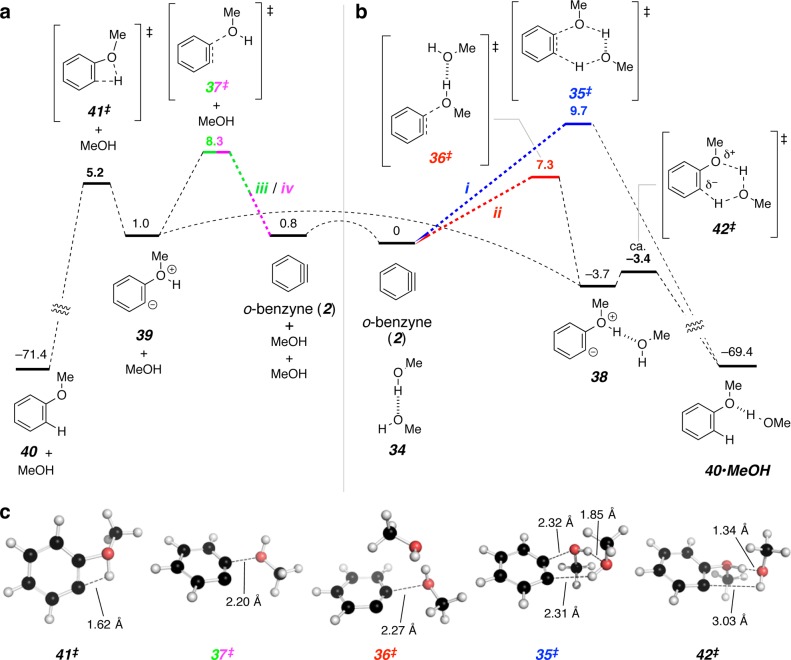
Figure 9.
DFT calculations were performed using M06-2X/6-311+G(d,p) and the SMD solvation model (MeOH). Standard state corrections (gas phase to 1 M solution) were applied to all structures and the concentration of methanol was adjusted to 24.7 M (neat methanol). All values are of the free energies in kcal·mol–1. Minima and TS structures of species in which one vs two methanol molecules have engaged o-benzyne (2) are shown in panels (a) vs (b), respectively. The curved dashed lines represent low barrier processes in which a new hydrogen bond to methanol is being formed to convert a species in panel (a) to one in panel (b). (c) A 3D view of the geometry of each of the five TS structures; the dashed lines in each represent atom pairs between which bond order is increasing in the forward reaction direction.

