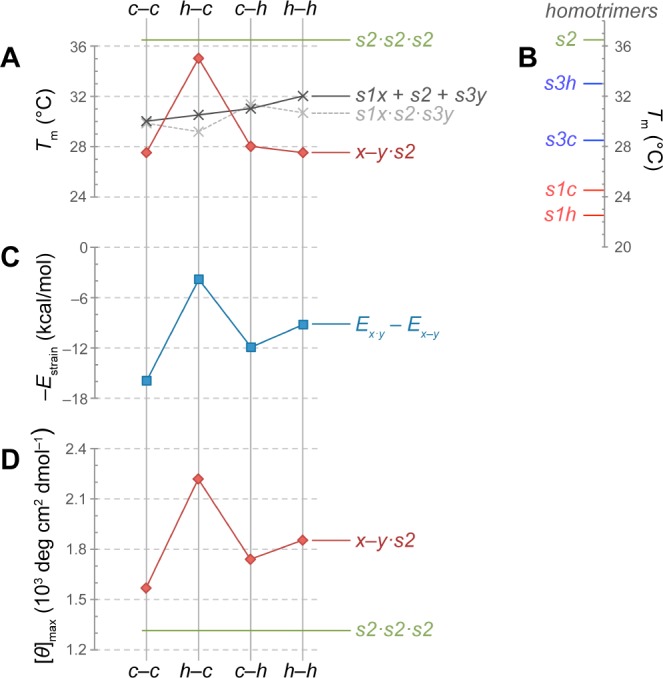
Figure 5.

Comparison of experimental and computational data for x–y·s2 and related triple helices. (A) Experimental (red and black) and calculated (gray) Tm values for heterotrimers. (B) Experimental Tm values for homotrimers. (C) Calculated strain energy, plotted as −Estrain to simplify comparisons with experimental data. (D) [θ]max from CD spectra acquired at 4 °C. Values for s2 (green) are included in panels A, B, and D for comparison.
