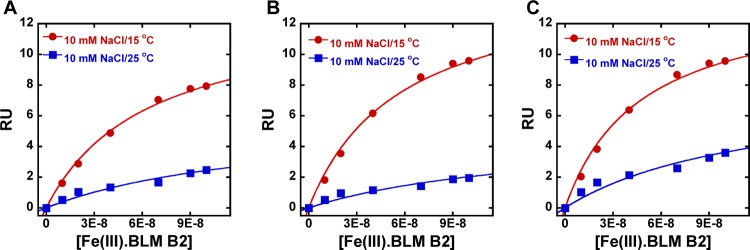
Figure 6.

SPR equilibrium binding plots of Fe(III)·BLM B2 with (A) hairpin DNA 7, (B) hairpin DNA 12, and (C) hairpin DNA 13 at 10 mM NaCl concentrations and 15 (red) and 25 (blue) °C. The steady-state response values were fitted as a function of free ligand concentration to a single-site interaction model. The binding affinities are listed in Tables 2 and Table 3
