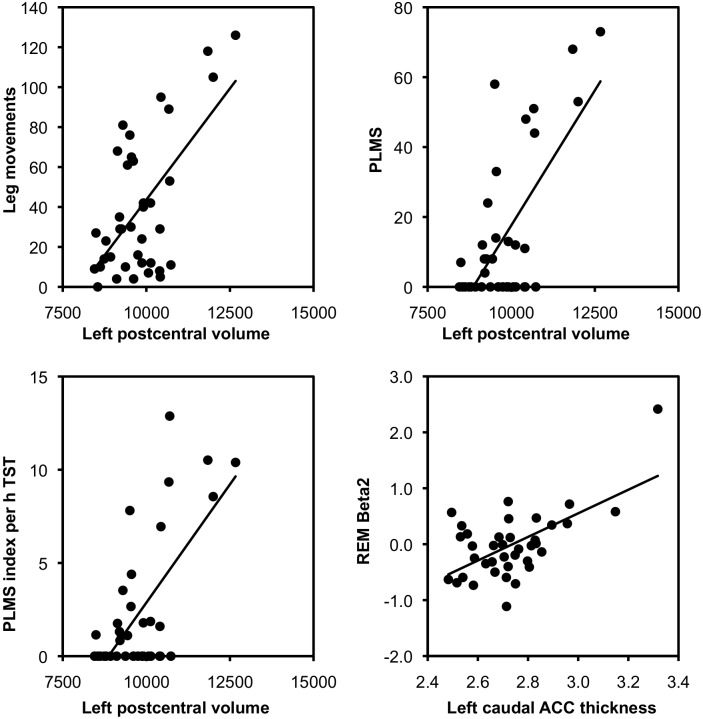
Figure 1. Scatter plots of relationships between brain structures and polysomnographic parameters.
Presented volumes are age-, sex- and ICV-adjusted by using the residual method. Solid lines represent regression lines. ACC = anterior cingulate cortex; ICV = intracranial brain volume; PLMS = periodic leg movements during sleep; REM = rapid eye movement sleep; TST = total sleep time.

