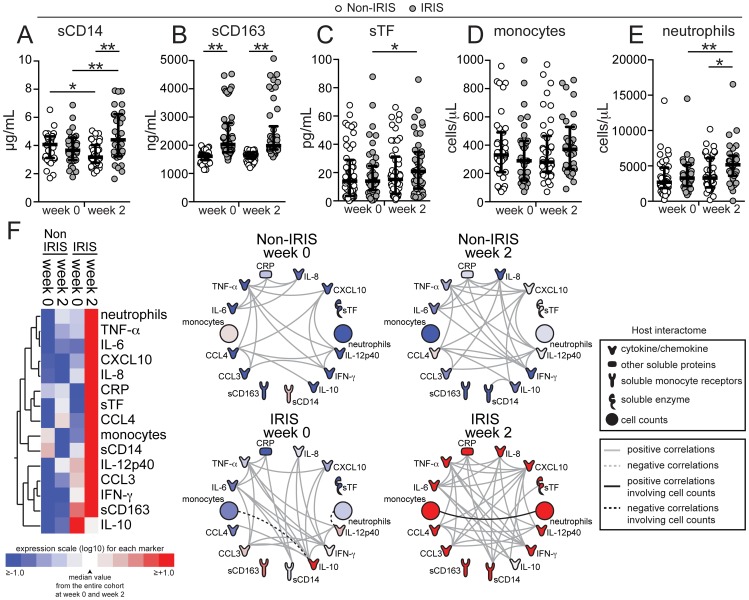
Figure 4. TB-HIV co-infected patients from South Africa exhibited a similar inflammatory biomarker pattern of paradoxical TB-IRIS as well as a lack of correlation between monocyte counts and soluble biomarkers of inflammation.
(A–D) Plasma levels of sCD14 (A), sCD163 (B), sTF (C), absolute monocyte count (D), and absolute neutrophil counts (E) were compared at week 0 (pre-ART) and at week 2 after ART initiation between TB-HIV co-infected patients that developed paradoxical TB-IRIS (n = 44) and those who did not (n = 52). Lines represent median values and interquartile ranges. Data were analyzed using the Mann-Whitney test or Wilcoxon matched-pairs test for paired comparisons within each study group. * P<0.05, ** P<0.01. (F) Left panel: A Heat map was designed to depict the overall pattern of expression of plasma cytokines, chemokines and inflammatory biomarkers in IRIS vs. non-IRIS patients at week 0 (pre-ART) and at week 2. A two-way hierarchical cluster analysis (Ward's method) of circulating biomarkers by clinical group and time point was performed. Expression scale for each biomarker represents log10 fold-change from the geometric mean of the entire study population at week 0 and week 2 or the time of IRIS (n = 96 at each study time point). Right panel: The network analysis (interactome) shows statistically significant correlations (P<0.05) between all the parameters measured. Data were analyzed using Spearman rank tests. See Data File S2 for additional details on the strength (r value) and level of significance (P-value) of each individual correlation.

