Figure 1.
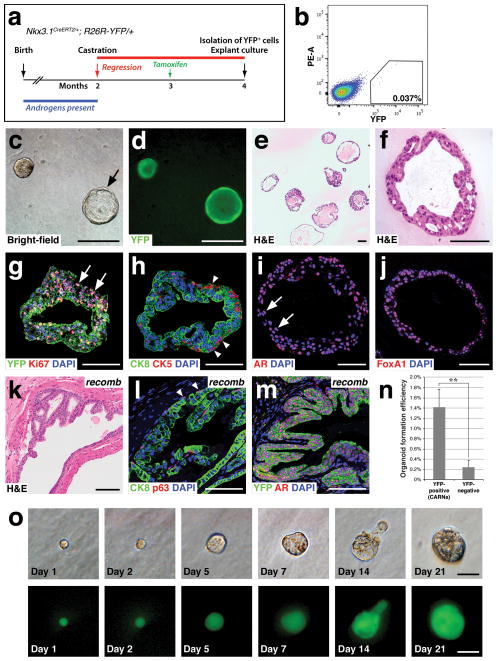
Generation of prostate epithelial organoids from lineage-marked CARNs. (a) Time course of lineage-marking of CARNs in Nkx3.1CreERT2/+; R26R-YFP/+ mice. (b) Isolation of YFP-positive lineage-marked CARNs by flow cytometry. (c,d) Bright-field (c) and epifluorescent (d) views of CARN-derived organoids that are filled or hollow (arrow). (e,f) Hematoxylin-eosin (H&E) staining of CARN organoids at low-power (e) showing range of phenotypes, and high-power (f). (g) Uniform YFP expression with Ki67 immunostaining (arrows). (h) The basal marker CK5 is expressed on the exterior (arrowheads), while the luminal marker CK8 is expressed internally. (i,j) Strong nuclear expression of AR (arrows, i) and Foxa1 (j). (k–m) Renal grafts generated by tissue recombination of CARN-derived organoids with rat embryonic urogenital mesenchyme (k) display normal stratification of basal (arrowheads, l) and luminal cells (l), and uniform YFP and nuclear AR immunostaining (m); note that the slightly atypical histology in (k) likely reflects the heterozygous phenotype of Nkx3.1 mutants40, 41. (n) Efficiency of organoid formation by lineage-marked CARNs (YFP-positive cells from tamoxifen-induced and castrated Nkx3.1CreERT2/+; R26R-YFP/+ mice; n=4 experiments) and non-CARNs (YFP-negative cells from the same mice; n=3 experiments). Source data are provided in Supplementary Table 1. Error bars represent one standard deviation; the difference between CARNs and non-CARNs is statistically significant (p = 0.002, two-tailed Student’s t-test). (o) Generation of organoids from single CARNs. Time course of paired images shown under bright-field (top) and epifluorescent (bottom) illumination shows organoid growth from isolated single CARN. Scale bars in o correspond to 25 microns, in f–j,l,m to 50 microns, and in c–e,k to 100 microns.

