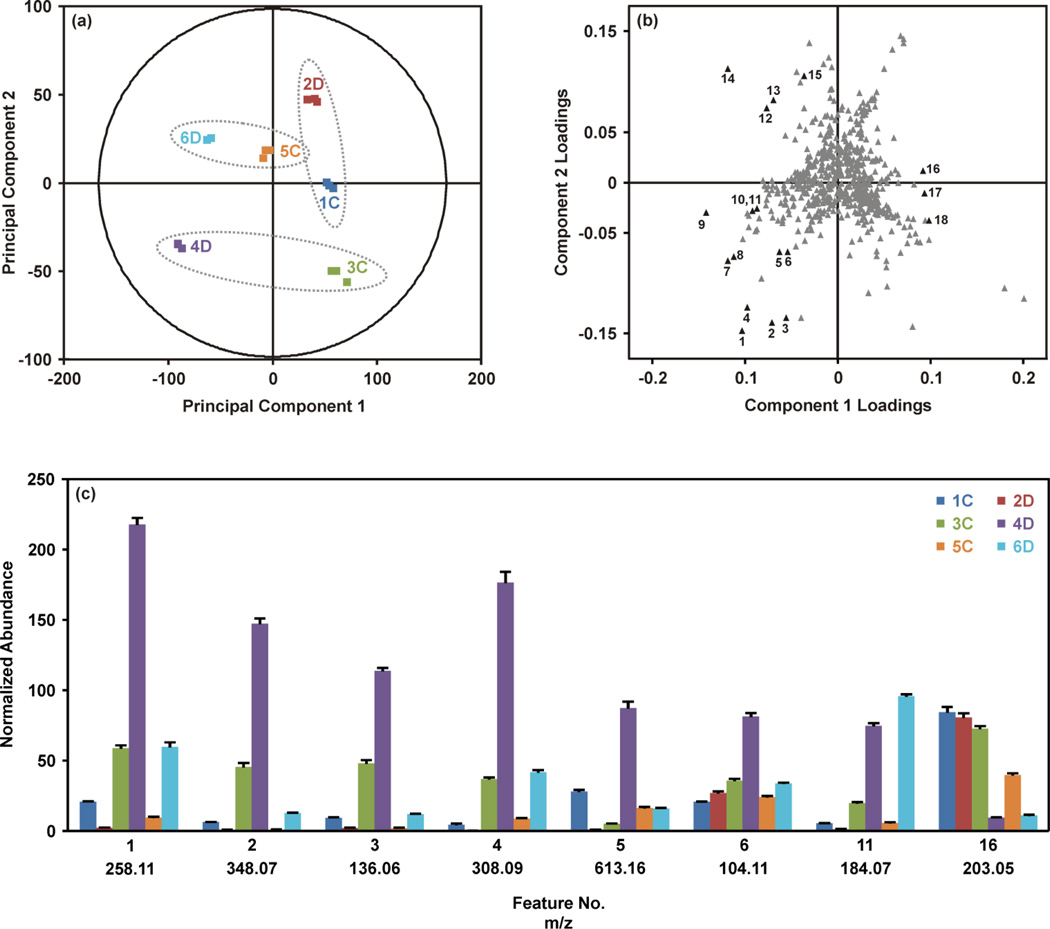
Figure 2.
Summary of the multivariate statistical analysis of the breast tissue extract dataset. (a) Grouping of technical replicates and separation of biological replicates is shown by PCA of the UPLC-IM-MS/MS data. The plot contains three technical replicates for each sample, and each sample is represented by a different color. Matched control and disease tissues are indicated with ellipses. (b) Analysis of the corresponding loadings plot indicates the molecular features contributing to the separation of the samples along PC1 and PC2. Select features (in black) showing statistical significance are numbered. Average normalized abundances from three technical replicates for select features are shown in (c). The coloring scheme is the same as (a). Error bars indicate the standard deviations of the means. See Biostatistics in the Materials and Methods section for full description of the normalization method.

