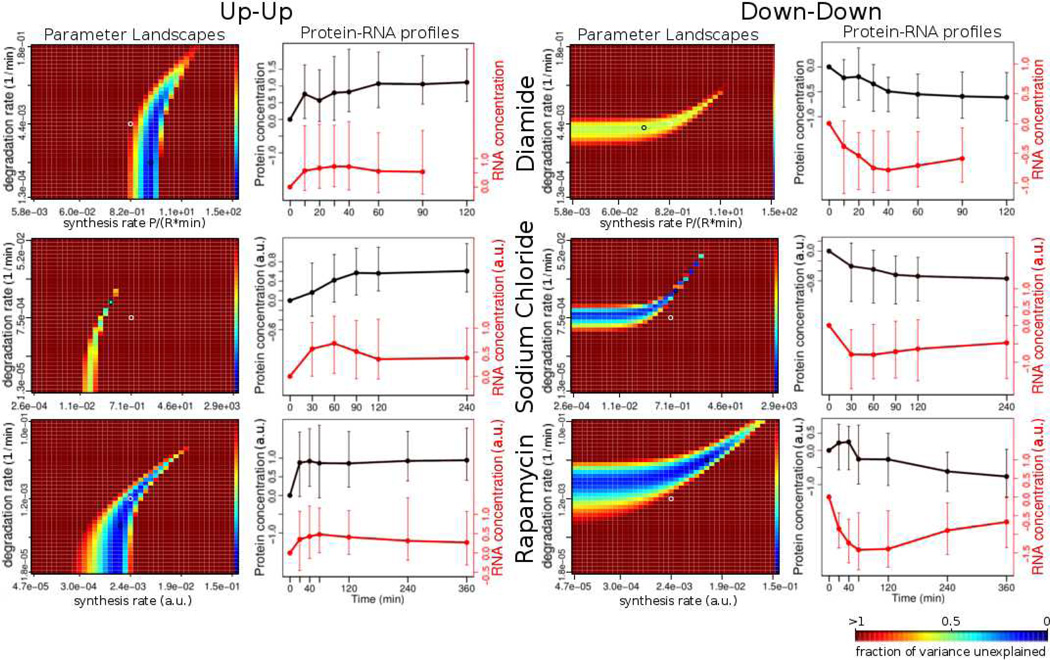
Figure 6. Parameter landscape clusters correspond to profile clusters.
Each heatmap shows a representative example for a cluster of parameter landscapes (see text). The ks and kd axes denote the synthesis and the degradation rates, respectively. The color represents the fraction of variance unexplained (fvu), with the bluer hue representing a lower value. The darkest red represents all values of fvu greater than or equal to 1.0. The line graph to the right of each heatmap represents the median profile of the profile cluster that has the largest intersection (by the number of genes in it) with the given cluster of parameter landscapes (see Table 2, Table S3). There are two major types of parameter landscape / profile cluster pairs: the “up-up” (left) and the “down-down” (right). These pairs occur in all three experiments (Diamide, Sodium chloride, Rapamycin), but contain different functional members (Table 2). P – protein concentration; R – RNA concentration, ks – synthesis rate, kd – degradation rate.

