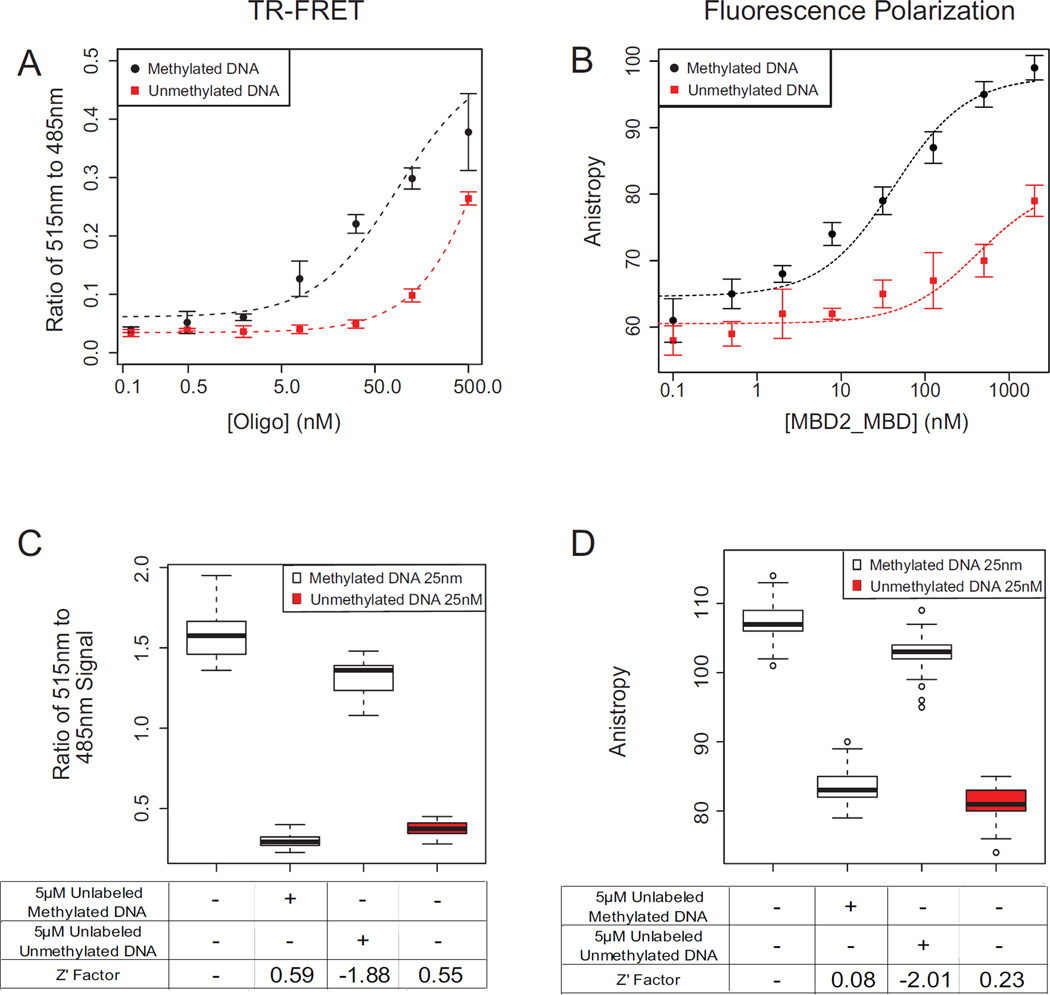
Figure 2. Assay performace of TR-FRET and Fluorescence Polarization MBD2-MBD DNA binding assays.
(A,B) The binding curves of MBD2-MBD to methylated and unmethylated DNA substrates was measured using the TR-FRET (A), and FP (B) assays. (C,D) Performance of the TR-FRET (C) and FP (D) assays with control treatments in 384 well format using 25 nM labeled substrate oligonucleotides. Lane 1 (DMSO vehicle control) and Lane 3 (excess unlabeled unmethylated DNA) are negative inhibitor controls; Lane 2 is a positive inhibitor control, consisting of excess fluorophore free methylated DNA. Lane 4 is an assay negative control, showing lack of binding with FAM labeled unmethylated DNA. Z’ factors are calculated relative to the DMSO vehicle control (Lane 1).

