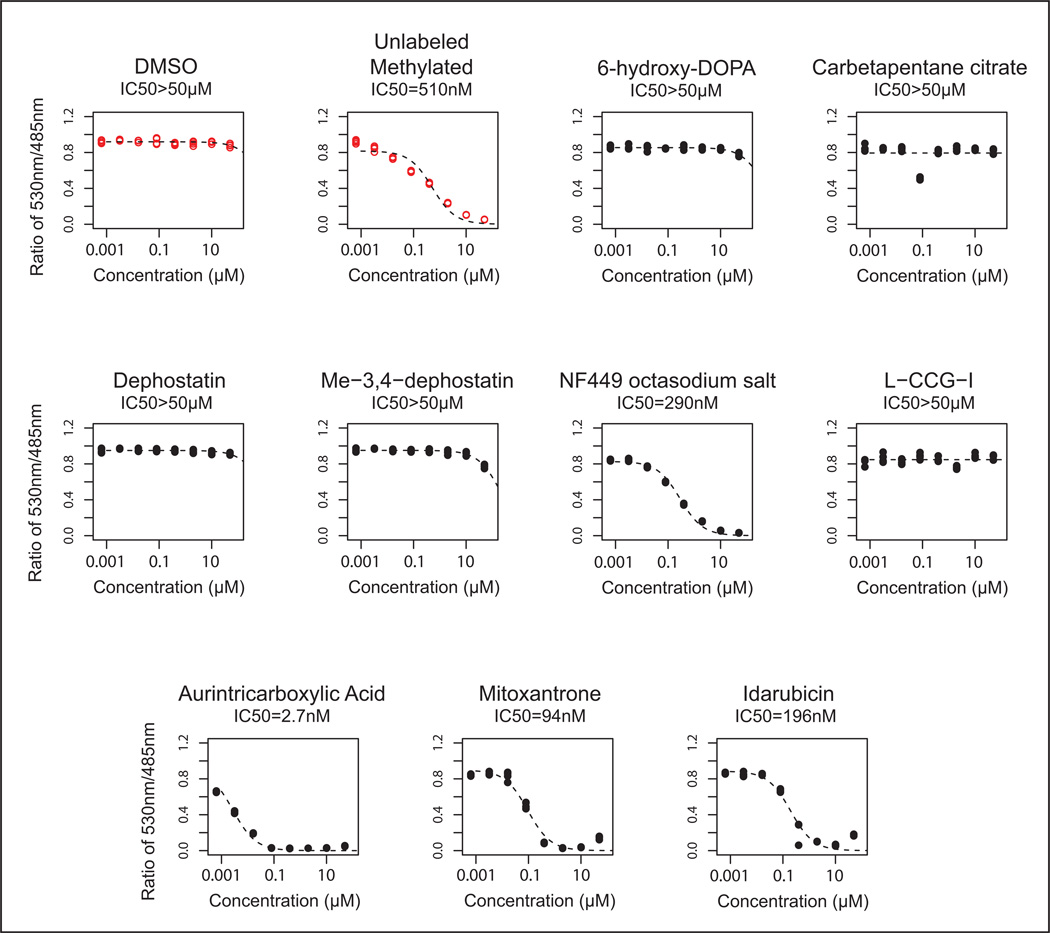
Figure 4. Dose response curves of significant hits.
The 9 hit compounds from the primary screen were tested with the TR-FRET assay using a 4-fold dose response series from 1.2nM to 20µM (4 replicates each). Controls are shown as red open circles. Four of the 9 compounds showed a potency for inhibition of MBD2-MBD binding to DNA within the dose range tested. IC50 values for each compound are listed below the title for each dose response.

