
Figure 2. Canonical pathways whose genes are most strongly modulated by cHMOS.
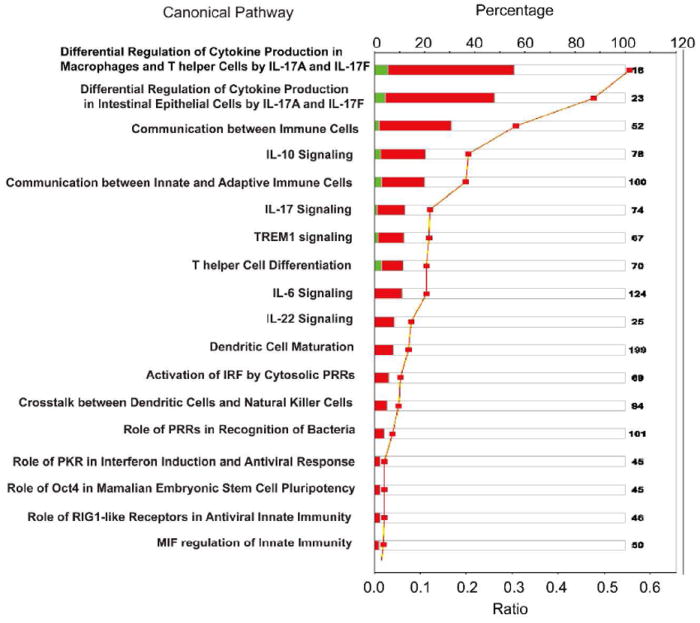
Canonical pathways whose transcription is influenced by cHMOS-treatment were identified by IPA analysis and rank ordered by the magnitude of their ratios. The names of canonical pathways are presented on the y-axis. Red bars, genes whose transcription was enhanced by cHMOS treatment; green bars, genes whose transcription was attenuated by cHMOS. Orange squares represented ratios calculated from changes in gene expression from Table 1.