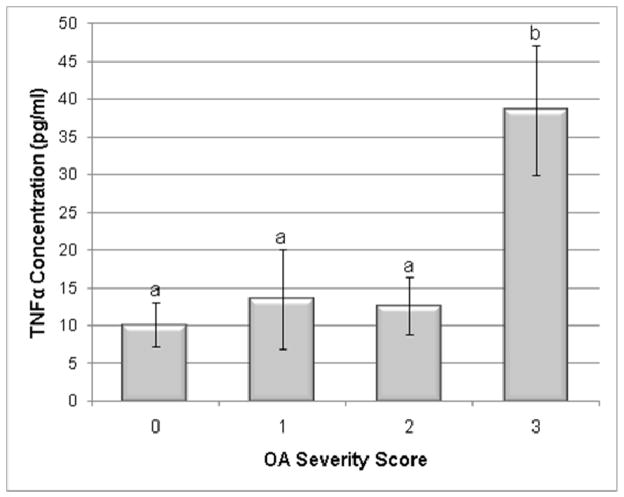
Figure 5.
Synovial fluid TNFα cytokine concentration in normal and OA joints. Categories were numbered as normal (0), mild OA (1), moderate OA (2), and severe OA (3). TNFα concentration was significantly increased in the severe OA group compared to the control group. Data presented as Mean ± SE. Differing letters indicate significant differences at p<0.05.

