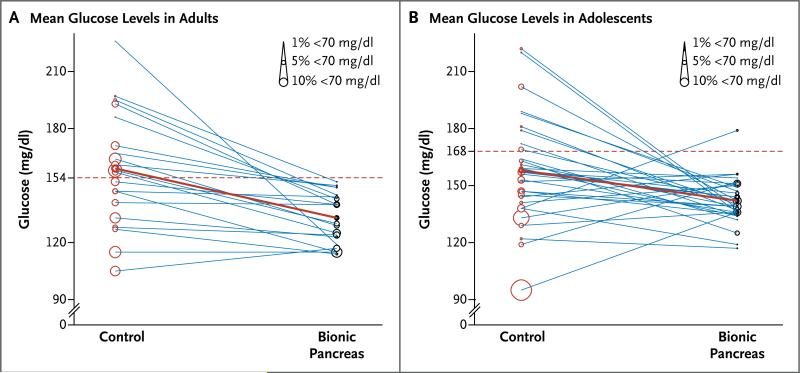
Figure 3. Distributions of Mean Glucose Levels and Hypoglycemia among Adults and Adolescents.
Panel A shows the mean glucose level in each adult on days 2 through 5 of the control period (red circles), which is connected to the corresponding mean glucose level during the bionic-pancreas period (black circles). The diameter of each circle is proportional to the percentage of time that the patient spent with a low glucose value (<70 mg per deciliter) on days 2 through 5. The dashed red line indicates a mean glucose threshold of 154 mg per deciliter, which corresponds to a glycated hemoglobin level of 7%, the upper limit of the therapeutic goal for adults as outlined by the American Diabetes Association. This goal was met in all patients during the bionic-pancreas period. Panel B shows a similar distribution for each of the adolescents, with a cutoff point for the mean glucose level of 168 mg per deci liter, which corresponds to a glycated hemoglobin level of 7.5%, as recommended for adolescents. The one patient in whom this level was not reached on days 2 through 5 had a mean glucose level of 148 mg per deciliter on days 3 through 5. In the two panels, the solid red line indicates the mean for all the patients in the study group. To convert the values for glucose to millimoles per liter, multiply by 0.05551.

