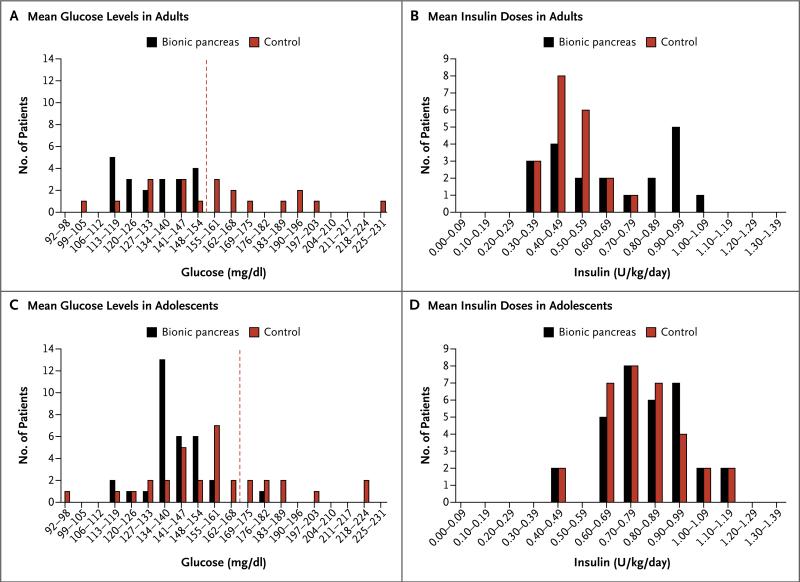
Figure 4. Histogram Distributions of Mean Glucose Levels and Insulin Doses among Adults and Adolescents.
Panel A shows a histogram distribution of the mean glucose levels on continuous monitoring in adults during the bionic-pancreas period and the control period. The distribution shows the number of patients with mean glucose levels divided into intervals of 7 mg per deci-liter on days 2 through 5. The dashed red line indicates a mean glucose level of 154 mg per deciliter, which corresponds to a glycated hemoglobin level of 7%. Panel B shows a similar histogram distribution of total daily doses of insulin in the adults, divided into intervals of 0.1 U per kilogram of body weight per day. Panels C and D show similar histogram distributions for the adolescents, with a cutoff point for the mean glucose level of 168 mg of glucose per deciliter, which corresponds to a glycated hemoglobin level of 7.5%. To convert the values for glucose to millimoles per liter, multiply by 0.05551.

