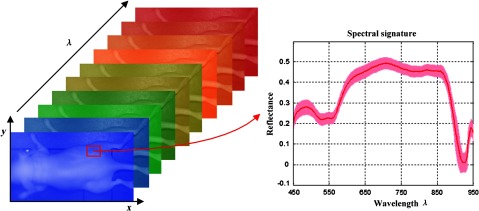
Fig. 1.

The data structure of a hypercube of hyperspectral imaging (HSI). The red solid line represents the average reflectance spectrum of the rectangular region of the tumor tissue in the mouse, and the color region around the solid line represents the standard deviation of the spectra in the same region.
