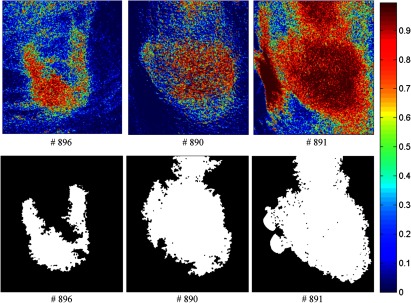
Fig. 16.

Classification maps. The first row represents the SVM probability map for Mice # 896, # 890, # 891, and the color bar on the right denotes the probability with different colors. The second row represents the corresponding binary tumor maps after active contour postprocessing.
