FIGURE 4.
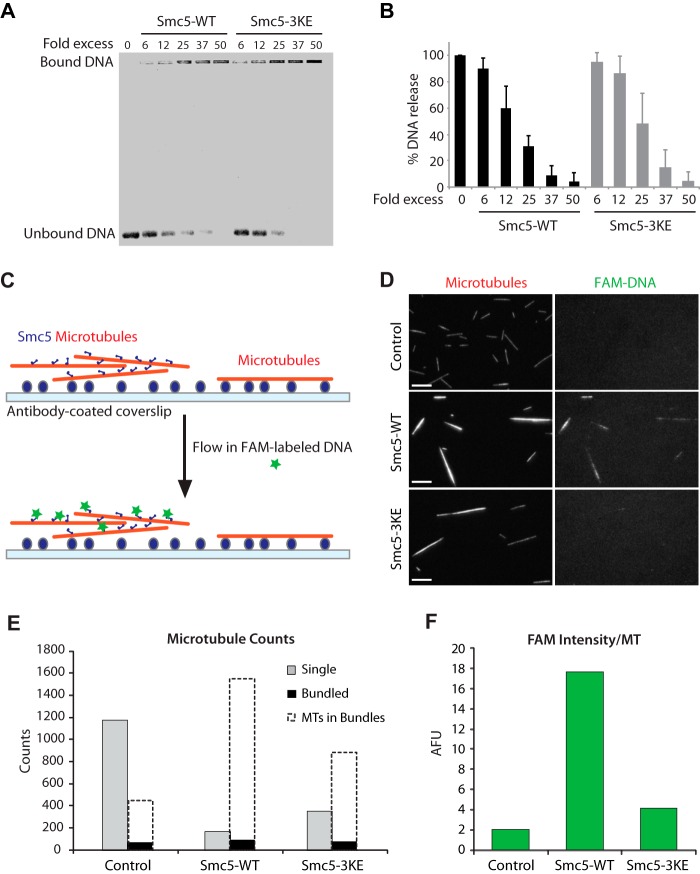
Smc5 protein can bind to DNA and microtubules simultaneously. A, DNA binding assay with Smc5-WT and Smc5-3KE. B, quantification of the DNA binding assay. Error bars, S.D. C, schematic depicting the microscopy-based assay to visualize the formation of the microtubule-Smc5-DNA ternary complex. D, representative images of the surface-anchored X-Rhodamine-labeled microtubules (red) that were untreated (microtubules alone) or preincubated with either Smc5-WT or Smc5-3KE. Right panels, corresponding images of the associated FAM-labeled single-stranded DNA oligonucleotides (ssDNA). Scale bars, 10 μm. E and F, quantification of the data set shown in D. E, counts of single microtubules (gray bars) and bundled objects (black bars) for each condition are shown. Dashed unfilled bars representing estimated numbers of averaged microtubules (MTs) in bundled objects, as described under “Experimental Procedures,” are overlaid onto the corresponding black bars to provide a measure on the sizes of the bundles. Note that there are more microtubules in the Smc5-WT bundles than in Smc5-3KE or control. F, to quantify the associated FAM-labeled DNA on microtubules, average FAM signal intensity in arbitrary fluorescence units (AFU) under each experimental condition was determined and shown in the histogram. Microscopy-based experiments shown in C and D were repeated more than three times in similar settings. A representative set is quantified and shown here in E and F.

