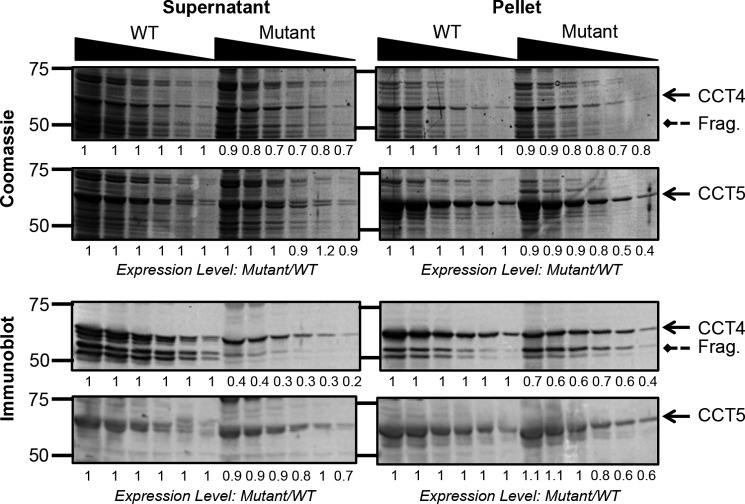
FIGURE 1.
Expression levels of CCT4, CCT5, and their neuropathy mutants. The supernatant (left) and pellet (right) of E. coli cells expressing CCT4 or CCT5 were diluted by half from 1:25 to 1:800. Solid arrows point to the full-length CCT protein, and dashed arrows point to the CCT4 fragment (Frag.) of 53 kDa. The expression levels were quantified using ImageJ and calculated for the mutants as mutant level divided by WT level for each dilution. For the Coomassie Blue-stained gels (upper), the expression levels were almost the same in the WT and mutant. The immunoblots (against CCT4 and CCT5, respectively; lower) show a decreased recovery of antigenic C450Y CCT4 compared with WT CCT4 in the supernatant.

