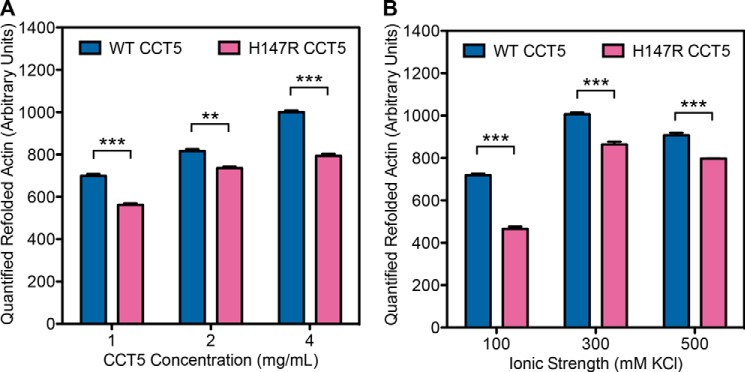
FIGURE 13.

Variations in protein concentration and ionic strength of β-actin refolded by CCT5 and its neuropathy mutant. The same assay as described in the legend to Fig. 12 was performed but with variations in protein concentration (A) and ionic strength of the buffer (B). H147R CCT5 refolded significantly less actin than WT CCT5 in all variations. There was a protein concentration dependence (A), and the optimal ionic strength was 300 mm KCl (B). The conditions used for Fig. 12 were normalized to 1000. Error bars are S.E. from three independent quantifications. **, significance at p < 0.01 by t test; ***, significance at p < 0.001 by t test.
