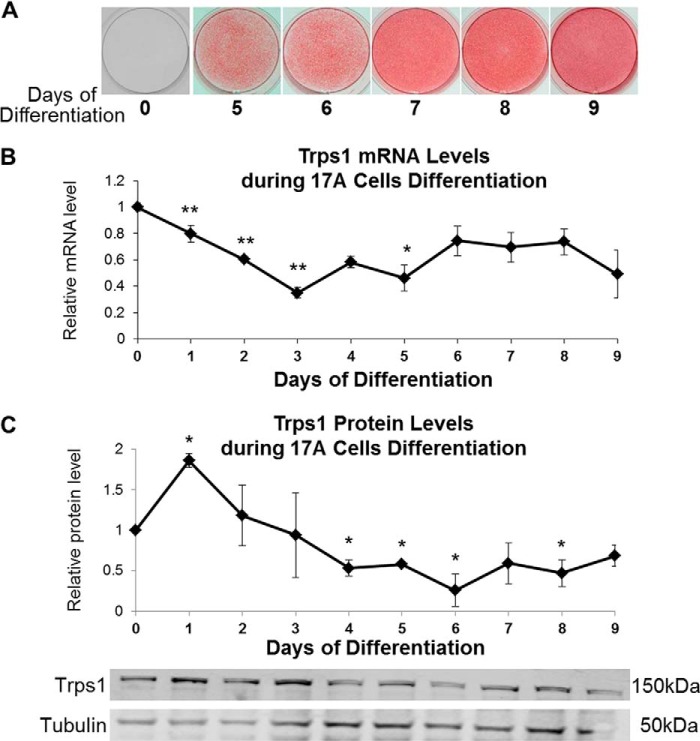
FIGURE 1.
Trps1 expression during osteo-odontogenic differentiation of 17A cells. A, representative images of alizarin red staining showing the progression of 17A-regulated mineralization. B, qRT-PCR results demonstrating Trps1 expression in 17A cells. Data are presented as the mean relative levels of Trps1 mRNA (normalized to Gapdh) ±S.D. from three independent differentiation experiments. Trps1 levels in undifferentiated 17A cells (day 0 of differentiation) were arbitrarily set at 1 and used as a reference for the remaining time points. C, Western blot analyses of Trps1 protein levels. Results of densitometric analyses (top) of Western blots (bottom) demonstrating relative Trps1 protein levels. Data are represented as the mean relative density of Trps1 normalized to tubulin (a protein loading control) ±S.D. from three independent differentiation experiments. Normalized Trps1 levels in undifferentiated 17A cells were arbitrarily set at 1 and used as a reference for the remaining time points. Asterisks denote statistically significant differences compared with day 0 of differentiation (*, p ≤ 0.05; **, p ≤ 0.005).

