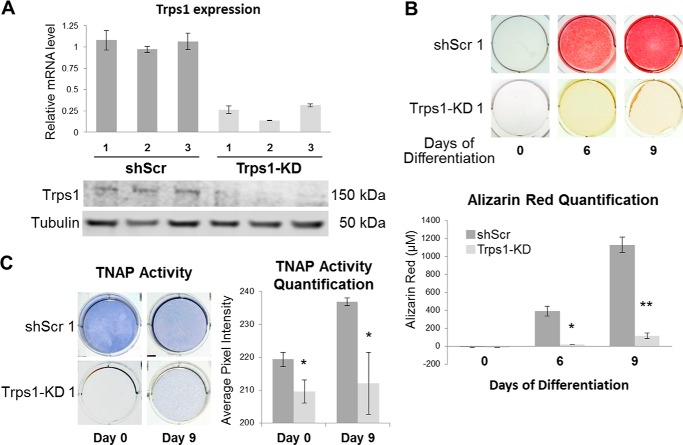
FIGURE 4.
Loss of mineralization potential in Trps1-deficient cells. A, qRT-PCR (top panel) and Western blot (bottom panel) results demonstrating depletion of Trps1 in 3 clonal stable cell lines (Trps1-KD) in comparison with controls (shScr). qRT-PCR data are presented as the mean relative levels of Trps1 mRNA normalized to Gapdh ±S.D. from 3 independent RNA preparations per cell line. Relative Trps1 levels in one of the shScr analyses was arbitrarily set to 1 and used as a reference for the remaining control and Trps1-KD cell lines. On the Western blot analyses of Trps1 protein, tubulin was used as a protein loading control. B, representative images of alizarin red staining (top panel) and quantification (bottom panel) of undifferentiated (day 0) Trps1-KD and control cells, and on day 6 and 9 of osteo-odontogenic differentiation. Quantification of alizarin red staining is presented as the mean ± S.D. from the differentiation experiments of three stable cell lines. C, representative images of TNAP activity staining (left panel) and quantification of the staining (right panel) in Trps1-KD and shScr cells demonstrate decreased TNAP activity in Trps1-deficient cells. Asterisks denote statistically significant differences (*, p ≤ 0.05; **, p ≤ 0.005).

