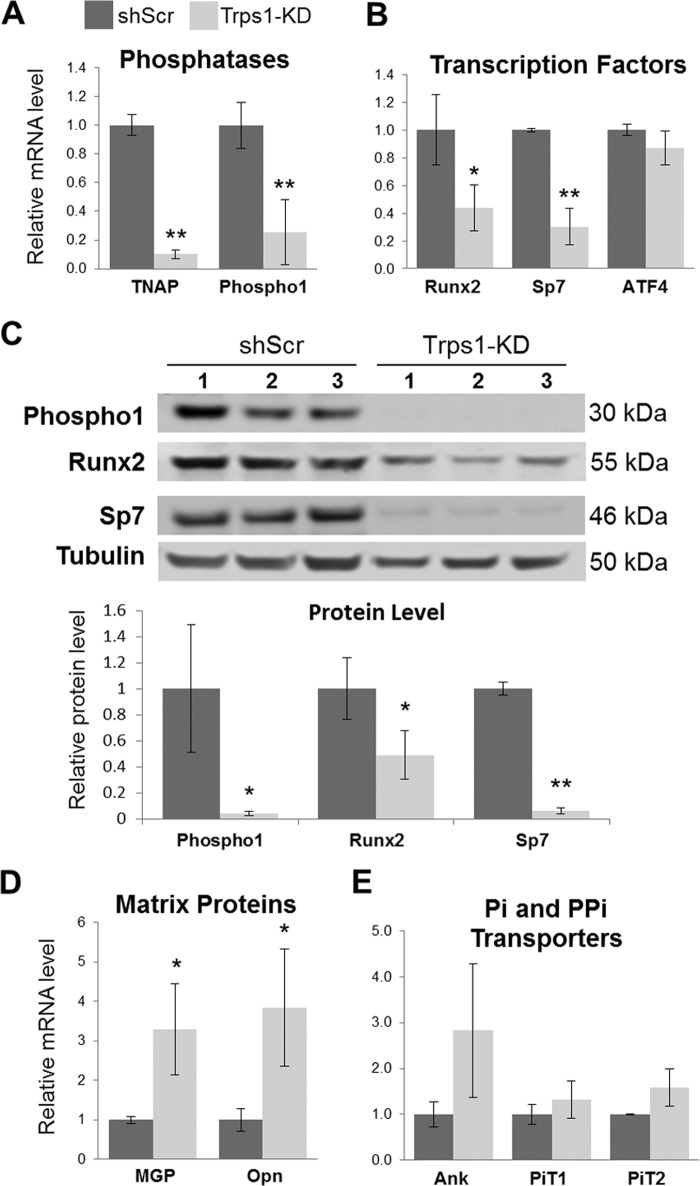
FIGURE 5.
Down-regulation of mineralization-supporting genes in undifferentiated Trps1-deficient cells. A, qRT-PCR results for TNAP and Phospho1 (phosphatases). B, qRT-PCR results for Runx2, Sp7, and ATF4 (osteogenic transcription factors). C, top panel, Western blot results confirming down-regulation of Phospho1, Sp7, and Runx2 in Trps1-KD cell lines. Tubulin was used as a protein loading control. Bottom panel, results of densitometric analyses of the Western blots. Protein levels were normalized to tubulin. D, qRT-PCR results for MGP and Opn (matrix proteins, mineralization inhibitors). E, qRT-PCR results for Ank, PiT1, and PiT2 (PPi and Pi transporters, respectively). qRT-PCR data were normalized to Gapdh and the average of shScr controls for each gene was arbitrarily set at 1 and used as a reference for all samples. The mean ± S.D. is shown for Trps1-KD and shScr. Asterisks denote statistically significant differences (*, p ≤ 0.05; **, p ≤ 0.005).

