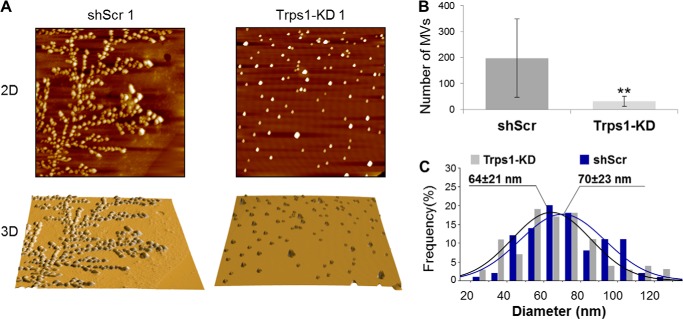
FIGURE 6.
Trps1 deficiency affects matrix vesicles. A, representative AFM images (scan size 10 × 10 μm) of MVs isolated from Trps1-KD and shScr cell lines. Topography (top panel) and three-dimensional surface rendering (bottom panel) are shown. B, number of MVs (mean ± S.D.) isolated from Trps1-KD and shScr cell lines. Asterisks denote statistically significant differences (**, p < 0.005). C, diameter distributions for MVs (n = 100 for each cell line) isolated from Trps1-KD and shScr cells.

