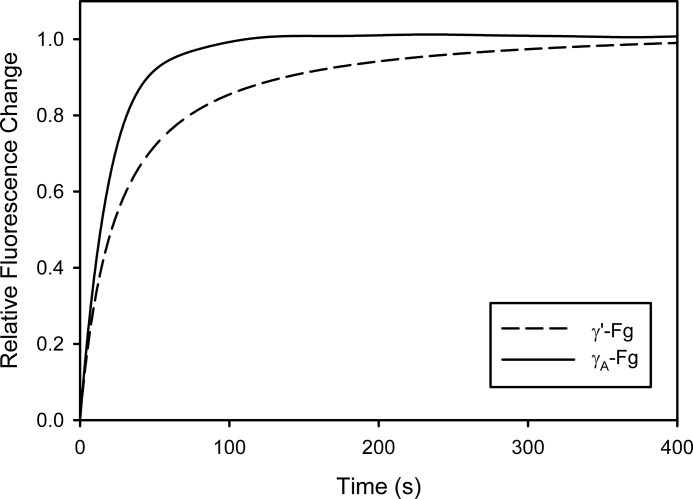
FIGURE 10.
Time courses of 5-IAF-Pg binding to γ′-Fn or γA-Fn formed by thrombin. A solution containing 7 μm γ′-Fg (dashed line) or γA-Fg (solid line), 5 mm CaCl2, and 5-IAF-Pg, in concentrations ranging from 0 to 0.7 μm, was added to wells containing 5 nm thrombin. Fluorescence was measured at excitation and emission wavelengths of 495 and 540 nm, respectively, with a cutoff filter at 530 nm. The fluorescence signals from individual time course profiles generated with each 5-IAF-Pg concentration were divided by the 5-IAF-Pg concentration and averaged. Fluorescence values were then expressed as relative change by dividing them by the maximum fluorescence change. Each line represents the mean of seven time course profiles.

