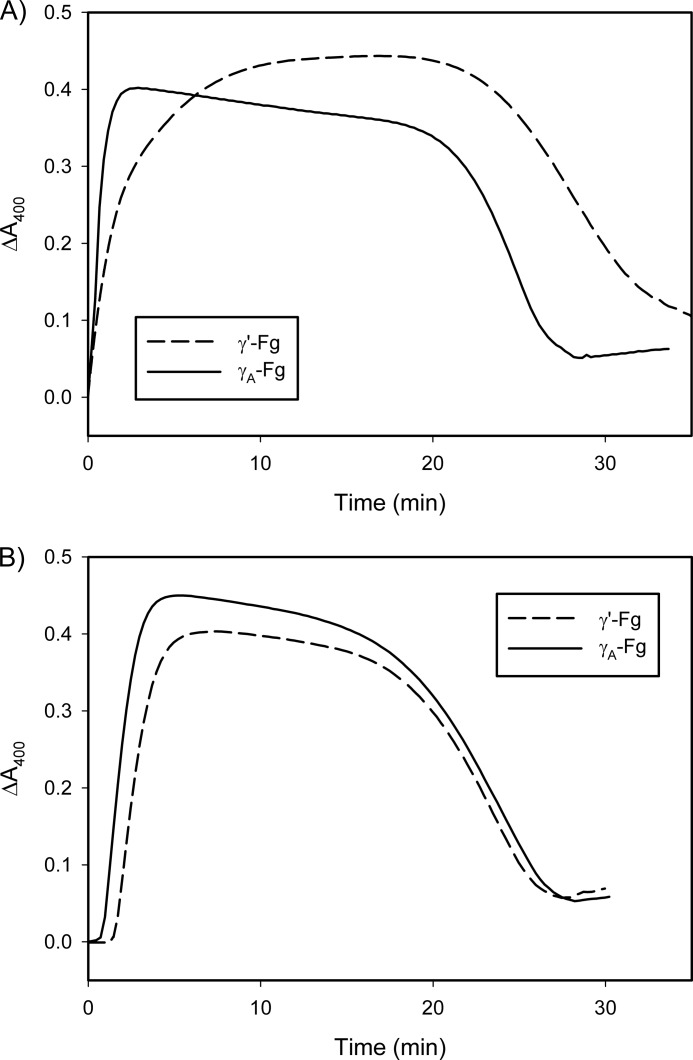
FIGURE 2.
Comparison of lysis times of clots formed from γ′-Fg or γA-Fg with thrombin (A) or batroxobin (B). γ′-Fg or γA-Fg (7 μm) was incubated at 37 °C with 0.05 μm Pg and 5 mm CaCl2 in HBS containing 0.01% Tween 80. Reactions were initiated by the addition of the Fg mixtures into wells of a 96-well plate containing separate aliquots of either 5 nm thrombin or 3 units/ml batroxobin, and 0.25 nm tPA, and absorbance was monitored at 400 nm. Lysis time was defined as the time to reach half-maximal decrease in absorbance. Experiments were done at least three times in duplicate, and representative plots are illustrated.

