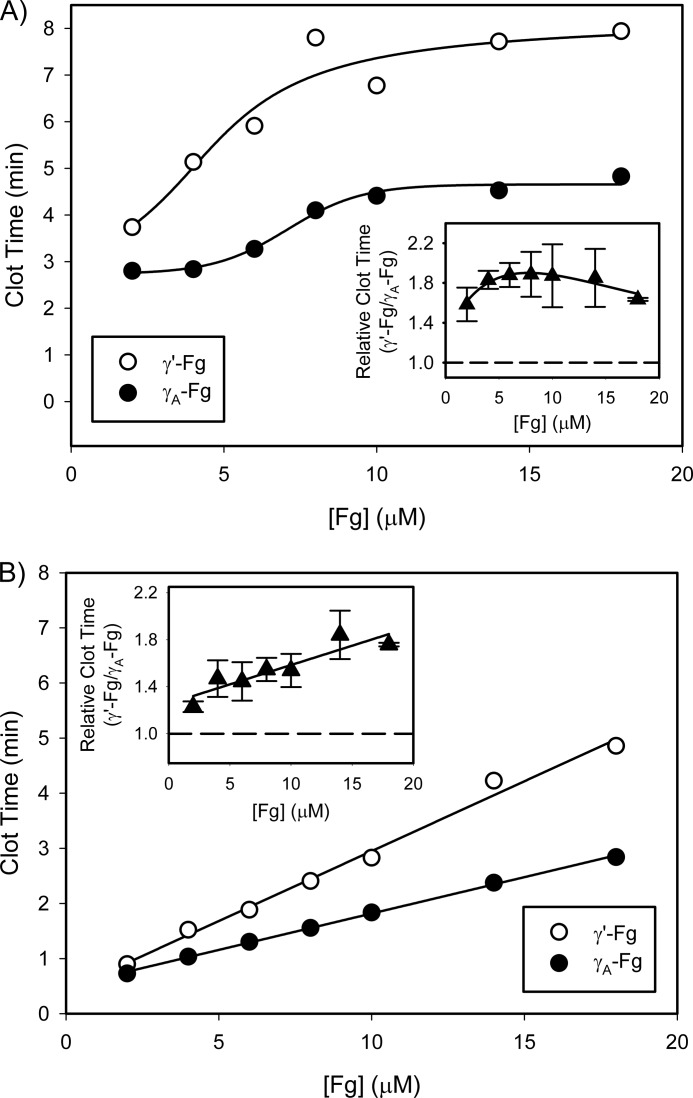
FIGURE 3.
Comparison of clotting times of γ′-Fg and γA-Fg when clotting is initiated with thrombin or batroxobin. γ′-Fg (open circles) or γA-Fg (closed circles), in concentrations ranging from 2 to 18 μm, was incubated at 37 °C with 5 mm CaCl2 in HBS containing 0.01% Tween 80. A and B, reactions were initiated by adding the mixtures to wells of a 96-well plate containing either 1 nm thrombin (A) or 1 unit/ml batroxobin (B). The insets represent the relative clotting times calculated by dividing the clotting time of γ′-Fg by that of γA-Fg. Symbols represent the means of at least three experiments, and the bars above and below the symbols reflect S.D. The lines connecting the symbols were generated to best fit the data.

