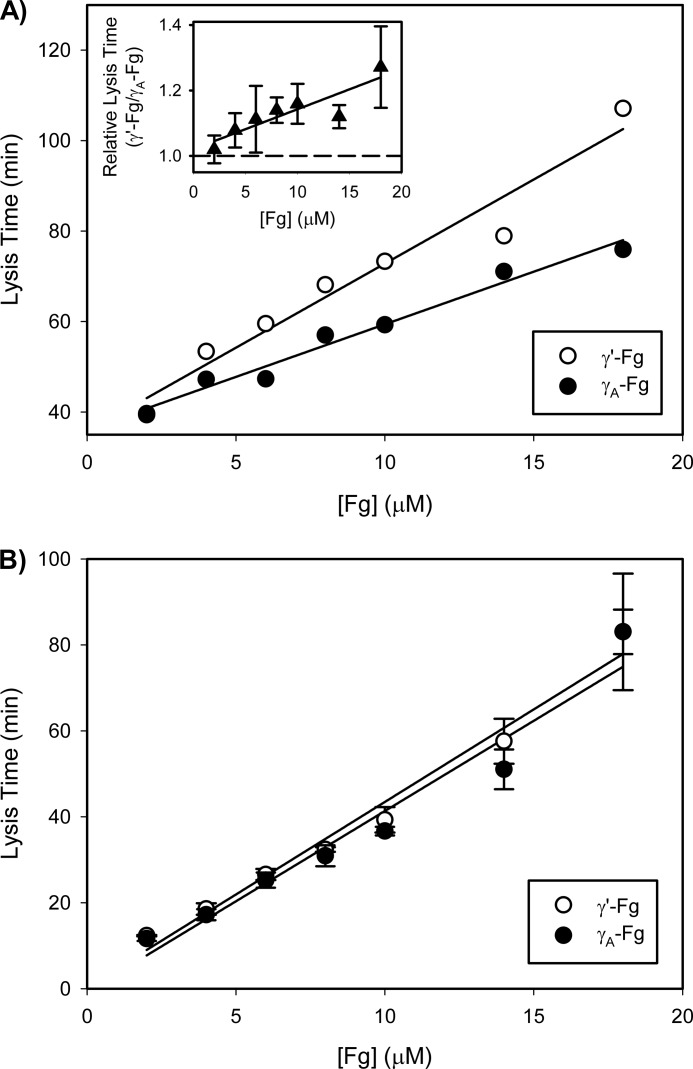
FIGURE 5.
Comparison of clotting of γ′-Fg or γA-Fg and lysis of γ′-Fn or γA-Fn clots. A, γ′-Fg (open circles) or γA-Fg (closed circles), at concentrations ranging from 2 to 18 μm, was incubated at 37 °C with 5 mm CaCl2, 0.33 μm α2-antiplasmin, and 0.67 μm Glu-Pg in HBS containing 0.01% Tween 80. Reactions were initiated by adding the mixtures to wells of a 96-well plate containing 5 nm thrombin and 0.25 nm tPA, and absorbance was monitored at 400 nm. A representative plot is illustrated. B, γ′-Fg (open circles) or γA-Fg (closed circles), at concentrations ranging from 2 to 18 μm, was incubated at 37 °C with 5 mm CaCl2 in HBS containing 0.01% Tween 80. Reactions were initiated by adding the mixtures to wells of a 96-well plate containing 5 nm thrombin and 5 nm Pn, and absorbance was monitored at 400 nm. In all experiments, clotting and lysis times were calculated as the times to half-maximal increase and decrease in absorbance, respectively. The inset in panel A shows the ratios of lysis times of γ′-Fn clots to those of γA-Fn clots. Symbols represent the mean of at least three experiments, while the bars above the symbols reflect S.D. Lines were generated by linear regression analysis.

